Friday, April 28, 2017

The Effect of the Nengda Incineration Plant on Residential Property Values in Hangzhou, China

Abstract:
Incineration plants and derelict industrial sites can have a number of adverse effects on the local environment and social welfare, including diminution of property values. Although many incineration plants exist in China, there has been relatively little research done to estimate the negative externality affects there. In this paper, we examine the effects of the Nengda municipal incineration plant in Hangzhou city on residential property values. We employ a hedonic pricing model to examine the sales of over 500 residential condominium units in over 20 multifamily buildings within ten kilometers of the incineration plants over a one-year-period including 2014. The results show that proximate properties show decreases in initial listing price of up to 25.9%, declining monotonically until the effect is gone at three kilometers from the incinerator. These results are comparable to similar situations in the United States and Canada.
by Qinna Zhao 1, Robert A. Simons 2, Fan Li-jun 1, Zhong Fen 1
1. Hefei University of Technology, Hefei, Anhui, China 230009 
2. Cleveland State University, Cleveland State University, Cleveland, OH 44115 or r.simons@csuohio.edu.
Journal of Real Estate Literature
Volume 24, Number 1; 2016; pages 85-102

Tuesday, April 11, 2017

New York Hospitals Tackle Zero-waste Goal with Help from EnviroPure Systems

EnviroPure, a self-contained food waste disposal system, is helping Montefiore Medical Center in New York reach its zero-waste goal by diverting more than 125 tons of food waste from landfills in less than two years, converting it instead into safe gray water.

Montefiore New Rochelle Hospital, a 242-bed facility located in New Rochelle, NY, installed the medical system’s first EnviroPure unit in September 2014 in order to handle 4,200 pounds of food waste produced each week.
...
After determining that the New Rochelle installation was successful in reducing costs and the environmental impact associated with food waste, Montefiore added a second unit at its Wakefield Campus, located in the Bronx, in 2015.

Within less than two years of installation, the New Rochelle unit alone has processed 250,000 pounds of food waste, resulting in 233,000 fewer pounds of carbon emissions and $15,000 in savings from waste hauling fees. Additional labor savings were realized over previous food waste management practices.
Image result for Enviropure Food Waste Montefiore NEw Rochelle
“EnviroPure has been a tremendous success for Montefiore. The system is simple to use for our staff, and data from the remote monitoring system shows us the impact we’re making on the environment and our bottom line,” Jeff Hogan, Montefiore Medical Center’s energy and sustainability manager said....

The EPA estimates more food reaches landfills and incinerators than any other single material in everyday trash and constitutes more than 20 percent of discarded municipal solid waste. Food waste in landfills produces environmentally damaging methane gas.

EnviroPure breaks down food waste in 24 hours through a combination of mechanical processing and aerobic decomposition and produces a gray water byproduct that meets or exceeds municipal wastewater requirements. A 100 percent natural micronutrient additive accelerates the digestive process with no intrusive odors, no invasive pests and no damaging carbon footprint.

For more information on EnviroPure, including an inside look at how the system works, visit www.enviropuresystems.com.

Press Release dated December 9, 2016
Health Care Facilities Today http://www.healthcarefacilitiestoday.com

Saturday, April 8, 2017

Study: Information On Peers, Not Money, Saves Energy

To reduce emissions that lead to pollution and climate change, policymakers around the world rely on energy efficiency policies. Yet, by far the greatest share of future energy consumption will come from the developing world. Identifying ways to encourage conservation is therefore an urgent policy priority. Which policies could best encourage households to save? That has been a trial-and-error exercise for policymakers for years. Now, a new analysis using India as a case study suggests one approach that might be both successful and easily implemented.

“With three hundred million people lacking access to reliable electricity in India, finding a way to conserve electricity is an essential policy objective,” says Anant Sudarshan, the author of the study and director of the Energy Policy Institute at the University of Chicago’s India office (EPIC-India). “This study demonstrates significant impacts via an approach that relies on simply telling households how they compare with their peers, and thus ‘nudging’ them to make the right choices. But it also shows how complicated human behavior can be. We provide new evidence showing that mixing monetary rewards and behavioral cues can turn into something that is less, not more, than the sum of 
its parts”.

Sudarshan used an experiment where one group of households received report cards comparing their electricity usage to that of their peers and providing tips for ways to save. A second group received the same report cards, but were also enrolled in a financial rewards program where they received money (or lost money) for reducing (or increasing) their electricity consumption in comparison to their peers.

The study found that the households that received informational “nudges” to save reduced their electricity use by 7 percent, and duplicating the effect of the "nudges" would require a tariff increase as high as 12.5 percent. But, contrary to what one might think, when monetary incentives were added, households no longer reduced consumption. 

“When money is thrown in to sweeten the deal, households react by asking themselves ‘Why is a utility paying me? What’s in it for them?’ And, is it going to cost me in the end?’” Sudarshan says. “This reflects a distrust that undermines the policy, making this distrust a problem not just for utilities but also for policymakers as they work to create effective policies.”

Do The Effects of Social Nudges Persist? Theory and Evidence from 38 Natural Field Experiments

Abstract
This study examines the mechanisms underlying long-run reductions in energy consumption caused by a widely studied social nudge. Our investigation considers two channels: physical capital in the home and habit formation in the household. Using data from 38 natural field experiments, we isolate the role of physical capital by comparing treatment and control homes after the original household moves, which ends treatment. We find 35 to 55 percent of the reductions persist once treatment ends and show this is consonant with the physical capital channel. Methodologically, our findings have important implications for the design and assessment of behavioral interventions.
12-2 can products - chart
Panel B of Table 6 presents the results of this exercise for the treatment and premove period. Consistent with Alcott and Rogers 2014 (AR), we start by assuming the direct cost of administering the Home Energy Report (HER) to one household is $1 per report. Following the standard approach in the literature, we simply compare this direct cost to savings achieved by the HER as estimated in Column 1 of Table 2 (-24.98 kWh) (No Technology). To also account for the indirect costs of the HER, we use a lower-bound estimate of the cost of capital per kWh of electricity saved in Allcott and Greenstone (2012, pp. 17).37 With this cost estimate, we convert savings achieved by capital investment—as a proportion of total savings using our estimates of persistence in the first row—into dollars. Applying this conversion, we see that the Home Energy HER induces an indirect cost that ranges from $0.74 to $1.15 per report and household. The resulting cost-effectiveness is reported in the last row for all three subsamples (Technology)

Comparing the two approaches to estimating cost-effectiveness in Panel B of Table 6, we see that incorporating the indirect cost of investments in capital more than doubles the cost per kWh in two out of three cases. From this perspective, after accounting for direct and indirect costs of technology adoption, alternative programs to the HER discussed in Allcott and Mullainathan (2010) and Allcott and Greenstone (2012) appear much more attractive. 

by Alec Brandon, Paul J. Ferraro, John A. List, Robert D. Metcalfe, Michael K. Price and Florian Rundhammer
National Bureau of Economic Research (NBER) www.NBER.org
NBER Working Paper No. 23277; Issued in March 2017

Better Buildings Showcase Project: Historic Auburn Courthouse

Background:
The Placer County Historic Courthouse, also known as the Auburn Courthouse, was built in 1898 and is listed on the National Register of Historic Places. This grand, three-story Classic Revival structure is topped by a bracketed cornice and simple Renaissance Revival-inspired dome. Over the years, the County made improvements, adding water fountains, fire escapes, and an elevator, which was installed in 1948. In 1990, the building underwent an extensive restoration effort. Since 2010 Placer County has implemented an energy efficiency retrofit to the Courthouse to reduce energy costs and improve occupant comfort.

Solutions:
Energy efficiency upgrades to the historic brick and stone building presented unique challenges due to the complex electrical wiring and the need to integrate new and old energy system components. Further complicating the process was the importance of completing the work while minimizing disruption to Court and museum operations, which continued throughout the upgrades.

From 2010 to 2016, the County upgraded major energy components at the Courthouse. The most significant energy savings retrofit measures, prioritized by energy saved, included:

  • Lighting retrofits: Aging and inefficient T-12 fluorescent linear systems were changed out to more efficient T-8 fluorescents, incandescent lamps in historic fixtures were changed to CFL, and interior sconce high-intensity discharge (HID) systems in courtrooms were retrofitted to CFL.
  • Central plant retrofits: An antiquated, 80-ton dual-reciprocating compressor chiller (Trane CGWC806RDNJJ432P, located in a separate building adjacent to the Courthouse) was replaced with an 80-ton high-efficiency scroll compressor chiller (York YCWL0084HE). The plant’s chilled water and condenser water pumps (and their associated motors) as well as the cooling tower fan motor were replaced. Variable speed drives were installed on the chilled water pump motors, condenser water pump motors, and the cooling tower fan motor. A water-side economizer was also installed to provide free cooling during periods when the ambient temperature drops below 65 F.
  • New high-efficiency boiler: The space-heating boiler at the Courthouse was replaced with a 92 percent efficient boiler. The old boiler was well beyond its remaining useful life. The pumping equipment (motors included) was also replaced and variable speed pump controls were implemented.
  • Window sashes, casings, and sills were updated and glazing was replaced with glass/polycarbonate laminate.
Auburn Courthouse aerial
Location: Auburn, California
Project Size: 25,000 square feet.

Annual Energy Use 
Baseline (2009): 252 kBtu/sq. ft.
Actual (2016): 177 kBtu/sq. ft.
Energy Savings: 30%
Annual Energy Cost
Baseline (2009): $89,000
Actual (2016): $76,000
Cost Savings: $13,000

Friday, April 7, 2017

Measuring the Welfare Effects of Residential Energy Efficiency Programs

Abstract:
This paper sets out a framework to evaluate the welfare impacts of residential energy efficiency programs in the presence of imperfect information, behavioral biases, and externalities, and then estimates key parameters using a 100,000-household field experiment. Several results run counter to conventional wisdom: we find no evidence of informational or behavioral failures thought to reduce program participation; there are large unobserved benefits and costs that traditional evaluations miss; and realized energy savings are only 58 percent of predictions. In the context of the model, the two programs we study reduce social welfare by $0.18 per subsidy dollar spent, both because subsidies are not well-calibrated to currently-estimated externality damages and because of self-selection induced by subsidies that attract households whose participation generates low social value. However, the model predicts that perfectly-calibrated subsidies would increase welfare by $2.53 per subsidy dollar, revealing the potential of energy efficiency programs....
From 2010 to 2013, the Better Buildings Neighborhood Program helped more than 40 competitively selected state and local governments develop sustainable programs to upgrade the energy efficiency of homes and buildings. These leading communities used innovation and investment in energy efficiency to expand the building improvement industry, test program delivery business models, create jobs, and save consumers hundreds of millions of dollars.
Even before quantifying welfare effects, the program evaluation process generates several important empirical results. First, in the randomized experiment, there is no evidence of the hypothesized informational or behavioral failures. Within the letter variations, only price mattered: while a $100 audit subsidy increased takeup by 32 percent relative to control, all six informational and behavioral variations had statistically and economically insignificant effects. 
...
Non-experimental investment takeup estimates imply that households that had audits were willing to pay an average of $330 for the unobserved attributes of a recommended investment, perhaps due to "warm glow" from contributing to externality reduction or from the improved comfort of a weatherized home. Furthermore, post-audit investment takeup was remarkably inelastic to monetary benefits and costs: consumers did not take up 40 percent of investments with private internal rates of return (IRRs) greater than 20 percent, and they did take up 36 percent of investments with negative private IRRs. This inelasticity implies that consumers perceive a wide dispersion in unobserved benefits and costs. These results highlight the importance of using revealed preference approaches to welfare analyses, instead of conventional accounting approaches that consider only observed monetary factors
...
We estimate that realized energy savings fell well short of predictions. Specifically, the programs’ simulation models predicted that the average household that had an audit made investments that would save $153 per year at retail prices, or about 8.5 percent of baseline energy expenditures. In contrast, we estimate an average savings of $89 per year, implying a "realization rate" of 58 percent. The shortfall cannot be explained by temporary weather patterns and is far too large to be caused by a "rebound effect" (i.e. increased utilization in response to the decreased cost of energy services).
...
The social internal rate of return (including externality reductions) of investments made through the programs is negative 4.1 percent using the empirical estimates of energy savings. To help address the question of whether these results generalize outside the two Wisconsin programs, Appendix E presents a parallel analysis using data from 37 Better Buildings program sites nationwide. We find that the national programs had slightly worse IRRs than the Wisconsin programs.
...
The full paper is currently available free of charge at:

by Hunt Allcott and Michael Greenstone
University of Chicago Department of Economics Becker Freidman Institue https://bfi.uchicago.edu/
April 4, 2017

Thursday, April 6, 2017

A Global Meta-Analysis of the Value of Ecosystem Services Provided by Lakes

Abstract
This study presents the first meta-analysis on the economic value of ecosystem services delivered by lakes. A worldwide data set of 699 observations drawn from 133 studies combines information reported in primary studies with geospatial data. The meta-analysis explores antagonisms and synergies between ecosystem services. This is the first meta-analysis to incorporate simultaneously external geospatial data and ecosystem service interactions. We first show that it is possible to reliably predict the value of ecosystem services provided by lakes based on their physical and geographic characteristics. Second, we demonstrate that interactions between ecosystem services appear to be significant for explaining lake ecosystem service values. Third, we provide an estimation of the average value of ecosystem services provided by lakes: between 106 and 140 USD$2010 per respondent per year for non-hedonic price studies and between 169 and 403 USD$2010 per property per year for hedonic price studies.
...
Considering the full sample, we find a mean value for lake ecosystem services equal to 315.1 USD$2010 per year (per respondent for NHP studies and per property for HP studies). The median value is 77.6 USD$2010 per year, showing that the distribution of values is skewed with a long tail of high values. On average, the values we find for ecosystem services provided by lakes are higher than the ones reported by Brouwer et al. (1999) for wetlands, 134 USD$2010 per respondent and per year.
...
Fig. 4 presents mean annual lake values per country (in USD$2010 per property per year for studies using an HP approach and in USD$2010 per respondent per year for studies using a NHP valuation method). When considering HP studies, United States rank first with a mean annual value of lakes per property equal to 442.5 USD$2010. The following countries in terms of mean value are New-Zealand, Ireland, Finland, and Canada with 392.2, 310.9, 265.9 and 166.1 USD$2010, respectively. When considering studies using another type of valuation method, Switzerland ranks first with a mean annual value of lakes per respondent equal to 765 USD$2010. The following countries are France, United States and Chile with respectively 644.7, 491.4 and 465 USD$2010 for the mean annual value of lakes per respondent. For countries where lake values are available both with an HP approach and with another valuation approach (i.e. Canada, China, England, Finland, Netherlands, New-Zealand and United States), we observe some significant differences across lake values depending upon the method of valuation. This indicates that the valuation method used in the primary study might have an impact on the estimated value.
Mean annual value of lakes per country and per valuation method.
In Fig. 5, we have split the annual value of a lake according to the presence or not of a specific ecosystem service (and still according to the valuation method used in the primary study). 
Mean annual value of lakes per ecosystem services and per valuation method.
... For NHP studies, the results obtained for different specifications of the basic meta-regression model described in Eq. (1) are presented below:

Six ecosystem services (among the nine specified) appear to be significant namely fishing, swimming, sightseeing, unpecified recreational, maintenance of populations and habitats and spiritual or symbolic appreciation. A particularly high value is found for the spiritual or symbolic appreciation service (+3.6 USD$2010 per year) whereas a low value is documented for the swimming service (+2.1 USD$2010 per year).
...
The different models presented in Tables 2 and 3 allow also to provide some estimates of the average lake value, see Table 4. When considering NHP studies and focusing on models ML3, ML4 and ML5, the average predicted values of a lake in our sample are 106, 120 and 140 USD$2010 per respondent per year. We get higher values when considering HP studies, respectively 169, 193 and 403 USD$2010 per property per year. This suggests that the ecosystem services capitalized in property prices are not equivalent to those valued using NHP approaches. Whatever the type of valuation method considered, our results demonstrate that lakes provide substantial monetary benefits to people....

New Report Shines Light on Installed Costs and Deployment Barriers for Residential Solar PV with Energy Storage

Researchers from the U.S. Department of Energy (DOE) National Renewable Energy Laboratory (NREL) are making available the most detailed component and system-level cost breakdowns to date for residential photovoltaic (PV) solar systems equipped with energy storage-and quantifying previously unknown soft costs for the first time.

The report, titled "Installed Cost Benchmarks and Deployment Barriers for Residential Solar Photovoltaics with Energy Storage: Q1 2016," was written by researchers from NREL, the Rocky Mountain Institute, and the Energy Department.

"There is rapidly growing interest in pairing distributed PV with storage, but there's a lack of publicly available cost data and analysis," said Kristen Ardani, lead author of the report and a solar technology markets and policy analyst at NREL. "By expanding NREL's well-established component- and system-level cost modeling methodology for solar PV technologies to PV-plus-storage systems, this report is the first in a series of benchmark reports that will document progress in cost reductions for the emerging PV-plus-storage market over time."
A square of perovskite crystal luminesces from a light being directed at in an NREL laboratory.
Declining costs in customer-side energy-storage products have opened the door for batteries to improve the value and flexibility of residential PV systems while falling costs in PV technologies have been driving the growing adoption of combined PV and storage solutions. However, gaps remain in developing an in-depth understanding of the costs of combined PV and battery systems and in effectively communicating their value proposition.

Through in-depth analysis of those costs and barriers to adoption, the report's authors provide technology manufacturers, installers, and other stakeholders with invaluable information to help guide their efforts to identify cost reduction opportunities. In addition, the analysis informs decision makers on market factors that are headwinds to further growth.

The analysis covers alternating current (AC)- and direct current (DC)-coupled systems for residential use, as well as retrofitting batteries to installed arrays, and the costs of enhancing the resiliency benefits of the combined system by switching to a battery with greater capacity. Both systems are designed to provide back-up power for critical loads in the event of a grid outage, and they enable a typical customer to optimize self-consumption of PV electricity-including peak-demand shaving and time-of-use shifting.

The authors separate installed system cost into 13 categories that range from direct hardware costs, such as the PV modules and batteries themselves, to soft costs that include items such as labor for installations, permitting and inspections, and net profits. The resulting cost for a DC-coupled system that integrates a 5.6-kilowatt (kW) PV array and a 3-kW/6-kilowatt-hour (kWh) battery is $27,703, which is roughly half hardware costs and half soft costs. An AC-coupled system, which can be more effective in applications that tend to use the energy from the PV array at the time of generation, costs $1,865 more if the battery is installed at the same time as the array. In settings where the battery is retrofitted to an existing AC-coupled system, the cost is increased by $3,218 to $32,786. The system design that provides for greater resiliency with a 5-kW/20-kWh battery costs $45,237 when DC-coupled and $47,171 when AC-coupled.

Good parks – bad parks: the influence of perceptions of location on WTP and preference motives for urban parks

Abstract:
Urban parks generate substantial public benefits, yet explicit economic assessments of such values remain relatively rare. Surveys of willingness to pay (WTP) were undertaken to assess such values for proposed new parks. The analysis assessed how preference motives and values varied according to the location of parks. Results revealed greater altruistic motivation and higher overall values for the creation of inner city as opposed to suburban parks. Spatial decomposition revealed that, after controlling for other determinants such as incomes, values generally increase for households closer to proposed parks, but that a significant downturn in values is evident for households located very close to a proposed inner city park; a finding which echoes concerns regarding the potential for such sites to provide a focus for antisocial behaviour. While these findings provide strong overall support for provision of public parks they highlight, the importance of perceptions of location and the potential for localised dis-benefits.
...
Suveys were administered face to face at participant’s homes. This enabled us to remind respondents of their budgetary constraints as well as the existence of potential substitute sites. Participants were informed that “we are researching the value of parks to the people of Norwich” and wished to interview people about their experiences and views.... Participants were shown stock photos of a verdant English park and informed that the park once complete would look like the photograph.... They were asked in an open ended format to explain their choice and to categorise their expected usage of the park into one of four categories.... Interviewers explained that the significant costs of creating the new parks would be met through an increase in their annual council tax bill.
File:River Yare, Earlham Park - geograph.org.uk - 1397889.jpg

Key results are in the table below:

 
...
The Tobit models produce very similar aggregate values for park A (Mean based = £1,130,674, Tobit based = £1,297,970) when protestors are ignored.  The inclusion of a lower bound to account for protestors in the Tobit model also resulted in similar values to the equivalent measure based aggregation (mean based = £933,302 Tobit based = 1,140,256). 
...
Results of the CV survey presented in this paper confirm previous findings that parks are highly valued public goods, with the creation of new parks in the city of Norwich having the potential to generate substantial value to residents. The low protest bid rate in the sample suggests that not only do residents have strong preferences towards the creation of new parks but that, at least in principle, they are willing to pay for increased provisioning through a familiar and realistic payment vehicle. Using an ex ante valuation allowed values and preference motives to be compared for two locations revealing significant differences in both mean WTP and its determinants.

Pick a number, but not just any number: valuation uncertainty and maximum willingness to pay

Abstract:
Empirical results suggest that contingent valuation method (CVM) respondents are uncertain of their valuations, which has led critics of the method to raise issues about its validity. Alternative approaches to resolve the problem have been proposed, involving different willingness to pay (WTP) response formats allowing respondents to explicitly express uncertainty. This paper compares differences between certain and uncertain responses for four different response formats. The results suggested that mean and median (WTP) were not significantly different for respondents who were certain about their valuations. This was generally not the case for respondents who were uncertain about their valuations. However, the median WTP was not found to be significantly different for uncertain and certain respondents. A conclusion for a standard CVM application is that the sample median WTP value could serve as a proxy measure of population maximum mean WTP when uncertainty has been removed.
...
The analysis is based on data from a mail survey on outdoor recreation in southern Sweden.... Some previous studies targeted visitors to a specific recreation area with corresponding high familiarity with the good being valued . By contrast, this study targeted ‘an average visit’ to an unspecified forest area the respondent uses based on the Right of Public Access. This customary right allows people to freely roam the countryside and put up camp for one night regardless of land ownership [which] ... is not traded in any market, implying that it has the characteristics of a public good ...
Beechwood Forest Skane Sweden (Nature)
The resulting sample would ... be expected to involve a wide range of familiarity with the good being valued....The hypothetical valuation scenario was the same for all questionnaire versions.... The ... valuation question [was] worded as follows:
Imagine that you would continue to visit and experience the forest as you normally do. You would travel the same distance to the forest and do similar activities. Consider that your expenses to visit the forest would increase, i.e. became larger than what you stated in the previous question. [which referred to the total cost related to an average forest visit, authors’ comment] How large would your total maximum cost for an average forest visit be before you would decide not to visit the forest?
The respondents were thus faced with the task of expressing their valuation as an equivalent variation (ev), i.e. the maximum WTP to avoid losing their current forest recreation.

The four response formats were open-ended (OE), interval open-ended (IOE), multiple-bounded dichotomous choice (MBDC) and what we have here chosen to call line scale (LS).... Three (OE, IOE and MBDC) of the four samples included a follow-up question on valuation certainty. Information was given that 100% probability would mean 100% acceptance of the stated amount and 0% probability would mean 0% acceptance of the stated amount, but the respondent was allowed to state any probability within those values....
...
[Responses are presented in the table below]
The OE survival curve is generally bounded by the IOE lower and upper bounds. The ranges differ substantially, as the highest reported value in the OE format was SEK 5000, whereas it was SEK 10,000 for the upper bound of the IOE format. Consequently, respondents gave considerably higher values than in the OE format when explicitly asked for their upper bound valuations in the IOE format. By weighting the responses with the reported uncertainties, the response distributions became more clustered as seen in Figure 4.

Figure 4. Survival curves for open-ended responses adjusted for valuation uncertainty.
...

The Surprising Pass-Through of Solar Subsidies

We estimate the pass-through of solar energy subsidies to solar system prices. Rich micro-level transaction and subsidy data from California indicate that pass-through is remarkably high and differs substantially for consumers who buy versus lease solar systems. Buyers capture nearly the full subsidy, while there is more-than-complete pass-through to lessees. We formalize pass-through over-shifting as an under-utilized test for market power that can also be applied in other contexts. We rule out alternative explanations for over-shifting and conclude that our estimates provide evidence for imperfectly competitive solar markets. Our findings have implications for the distributional effects of energy subsidies.
...
Consumers who buy capture nearly the full subsidy amount|about 86 cents for every dollar increase in subsidies|while there is more-than-complete pass-through to consumers who lease. For lessees, our estimates imply that a $1 increase in subsidies translates, on average, into a decrease in solar system prices of $1.65. We thus find that solar subsidies are predominantly (and sometimes even more than fully) passed through to consumers, despite popular claims to the contrary. These results are robust to a variety of sensitivity checks and alternative specifications. 
...
The substantial difference in pass-through is not only interesting to highlight that HO and TPO systems cannot be treated as a single market for solar panels, but also because it suggests that buy and lease markets could differ in other contexts, such as automobiles, planes, and computers. Consequently, future research could focus on how tax incidence differs across the buy and lease segments of such markets. 

Perhaps most importantly, we argue that estimating pass-through and finding that it over-shifts can serve as a powerful diagnostic for detecting market power that can be applied beyond the solar market....
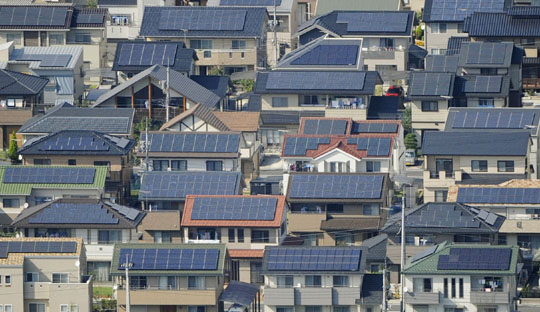
The fastest and cheapest way to reduce carbon emissions is more renewables and energy efficiency. This city in Japan shows what can be done....
by Jacquelyn Pless and Arthur A. van Benthem
National Bureau of Economic Research (NBER) www.NBER.org
NBER Working Paper No. 23260; Issued in March 2017