Showing posts with label Forestry. Show all posts

Wednesday, January 8, 2020

Moral Hazard, Wildfires, and the Economic Incidence of Natural Disasters

Abstract:
This study measures the degree to which large public expenditures on wildfire protection subsidize development in harm's way. Using administrative firefighting data, we calculate geographically-differentiated implicit subsidies to homeowners throughout the western USA. We first examine how the presence of homes affects firefighting expenditures. These results are used to reconstruct the implied historical cost of protecting each home and to perform an actuarial calculation of expected future protection cost. The expected net present value of this subsidy can exceed 20% of a home's value. It increases with fire risk and decreases surprisingly steeply with development density. A simple model is used to explore effects on expansion of developed areas, density, and private risk-reducing investments. These results demonstrate how policy and institutions influence the costs imposed by a changing climate.
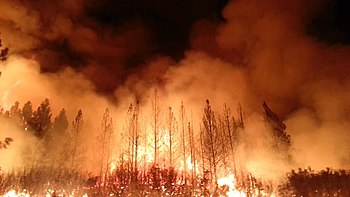
The Rim Fire burned more than 250,000 acres (1,000 km2) of forest near Yosemite National Park, in 2013https://en.wikipedia.org/wiki/Wildfire
...
During 1985–2017 total wildfire property damages in the United States were $51 billion, while direct firefighting costs for federal agencies alone totaled $43 billion.
...
A sample of homes including all 8.6 million homes in the western US located near areas of wildland vegetation (44% of all western US residential homes, condos, and apartments)....The range of historical protection costs is large. The average net present value ranges from a few hundred dollars per home for the lowest-cost cells to almost $100,000 per home in the highest-cost cells.
...
Using the “suppression only” measure, 50% of WUI homes have expected protection costs under $500, while the highest-risk homes have costs that are much larger. Five percent of homes have expected costs exceeding $3,800. One percent of homes have expected protection costs exceeding $12,700. Using the “suppression plus” measure results in higher costs. The 95th and 99th percentiles of this distribution are about twice as high as for the “suppression only” measure.
...
In 2014, California began requiring homeowners in the Cal Fire protection area to pay an equal annual fee of about $150 per year. The fee proved unpopular among homeowners and was suspended in 2017. This study shows that such a fee would need to be much more geographically differentiated in order to correct incentives (as opposed to simply raising revenue). Another lesson from this study is that exempting owners of existing homes could increase the political acceptability of such a policy without reducing its effectiveness, since the protection costs we estimate are not generally high enough to justify abandonment of existing homes. An alternative would be to assign firefighting costs to local governments, which would recover them through property taxes or other measures. This approach would incentivize cities and counties to consider fire protection costs in zoning, land use, and building codes/


https://www.nber.org/papers/w26550
by Patrick Baylis and Judson Boomhower
National Bureau of Economic Research (NBER) www.NBER.org
NBER Working Paper No. 26550; Issued in December 2019

Wednesday, May 10, 2017

Tropical Forests, Tipping Points, and the Social Cost of Deforestation

Abstract:
Recent work has suggested that tropical forest and savanna represent alternative stable states, which are subject to drastic switches at tipping points, in response to changes in rainfall patterns and other drivers. Deforestation cost studies have ignored the likelihood and possible economic impact of a forest-savanna critical transition, therefore underestimating the true social cost of deforestation. We explore the implications of a forest-savanna critical transition and propose an alternative framework for calculating the economic value of a standing tropical forest. Our framework is based on an average incremental cost method, as opposed to currently used marginal cost methods, for the design of optimal land-use policy or payments for ecosystem services. We apply this framework to the calculation of the social cost of deforestation of the Amazon rainforest.
...
Table 1 shows estimates for the present value of the foregone economic benefits from one hectare of Amazon deforestation. These are marginal values in that they represent the change in value for a small change in the forest area, at current deforestation levels.
Most of the numbers in this table are derived from estimates from two deforestation cost studies of the Brazilian Amazon, Andersen et al. (2002) and Margulis (2004). In order to make these estimates comparable and accessible, the collected values were updated to 2016 US$ values (i.e., adjusted for inflation), and converted into present values using a common discount rate, 2.5%, based on survey results in Pindyck (2016). In addition to the sources for each estimate, Table 1 also shows the method used for each calculation. 
...
In order to estimate the economic loss from a forest-savanna transition, it is necessary to estimate the change in average economic value of a representative hectare of forest that undergoes the state transition.

Thursday, April 6, 2017

Pick a number, but not just any number: valuation uncertainty and maximum willingness to pay

Abstract:
Empirical results suggest that contingent valuation method (CVM) respondents are uncertain of their valuations, which has led critics of the method to raise issues about its validity. Alternative approaches to resolve the problem have been proposed, involving different willingness to pay (WTP) response formats allowing respondents to explicitly express uncertainty. This paper compares differences between certain and uncertain responses for four different response formats. The results suggested that mean and median (WTP) were not significantly different for respondents who were certain about their valuations. This was generally not the case for respondents who were uncertain about their valuations. However, the median WTP was not found to be significantly different for uncertain and certain respondents. A conclusion for a standard CVM application is that the sample median WTP value could serve as a proxy measure of population maximum mean WTP when uncertainty has been removed.
...
The analysis is based on data from a mail survey on outdoor recreation in southern Sweden.... Some previous studies targeted visitors to a specific recreation area with corresponding high familiarity with the good being valued . By contrast, this study targeted ‘an average visit’ to an unspecified forest area the respondent uses based on the Right of Public Access. This customary right allows people to freely roam the countryside and put up camp for one night regardless of land ownership [which] ... is not traded in any market, implying that it has the characteristics of a public good ...
Beechwood Forest Skane Sweden (Nature)
The resulting sample would ... be expected to involve a wide range of familiarity with the good being valued....The hypothetical valuation scenario was the same for all questionnaire versions.... The ... valuation question [was] worded as follows:
Imagine that you would continue to visit and experience the forest as you normally do. You would travel the same distance to the forest and do similar activities. Consider that your expenses to visit the forest would increase, i.e. became larger than what you stated in the previous question. [which referred to the total cost related to an average forest visit, authors’ comment] How large would your total maximum cost for an average forest visit be before you would decide not to visit the forest?
The respondents were thus faced with the task of expressing their valuation as an equivalent variation (ev), i.e. the maximum WTP to avoid losing their current forest recreation.

The four response formats were open-ended (OE), interval open-ended (IOE), multiple-bounded dichotomous choice (MBDC) and what we have here chosen to call line scale (LS).... Three (OE, IOE and MBDC) of the four samples included a follow-up question on valuation certainty. Information was given that 100% probability would mean 100% acceptance of the stated amount and 0% probability would mean 0% acceptance of the stated amount, but the respondent was allowed to state any probability within those values....
...
[Responses are presented in the table below]
The OE survival curve is generally bounded by the IOE lower and upper bounds. The ranges differ substantially, as the highest reported value in the OE format was SEK 5000, whereas it was SEK 10,000 for the upper bound of the IOE format. Consequently, respondents gave considerably higher values than in the OE format when explicitly asked for their upper bound valuations in the IOE format. By weighting the responses with the reported uncertainties, the response distributions became more clustered as seen in Figure 4.

Figure 4. Survival curves for open-ended responses adjusted for valuation uncertainty.
...

Sunday, January 15, 2017

Governance and implementation challenges for mangrove forest Payments for Ecosystem Services (PES): Empirical evidence from the Philippines

Highlights
• Economic, social, and governance challenges for mangrove PES are investigated.
• The research uses primary data from two coastal sites in the Philippines.
• Mangrove carbon PES could contribute an additional 2.3–5.8% to current village income.
• Payments could finance ventures that counteract the environmental benefits of schemes.
• PES may require multi-level and multi-actor governance with local participation.

Abstract
Mangrove forests have been considered as potentially suitable for PES, though few mangrove PES schemes exist worldwide, suggesting they - and the broader social-ecological and governance systems in which they sit - may not be as conducive to PES as first thought. This study assesses economic, social, and governance challenges to implementing PES in mangroves. It draws on empirical evidence from two prospective community-level mangrove carbon PES schemes in the Philippines, where fishing and aquaculture are major livelihoods. We conducted (1) policy reviews and interviews with local communities, government, and NGOs to investigate governability; (2) village income accounting to determine the extra income that participants could receive through PES; and (3) a choice ranking exercise to elicit preferences on how payments could best be spent to enhance participant wellbeing. The latter approach identifies key gender differences, and enables potential PES-induced social-ecological trade-offs to be pre-empted. Blue carbon PES can contribute an additional 2.3–5.8% of current village incomes, while villagers would prefer to spend the monies on more effective fishing equipment, which could perversely jeopardize fishery sustainability. To be most successful, coastal PES schemes in the Philippines need to be managed through a multi-level governance regime involving co-management and local participation.
Mangrove forest at low tide, Philippines
by Benjamin S. Thompson 1, , , Jurgenne H. Primaver 1 and 2, Daniel A. Friess 1
1. Department of Geography, National University of Singapore, 1 Arts Link, Singapore 117570, Singapore
2. Community-Based Mangrove Rehabilitation Project, Zoological Society of London, 132 Quezon St., Iloilo City, Philippines
Ecosystem Services http://www.sciencedirect.com/science/journal/22120416 via Elsevier Science Direct www.ScienceDirect.com
Volume 23, February 2017, Available online 28 December 2016; Pages 146–155

Keywords: Benefit sharing; Blue carbon; Conservation; Gender; Perverse incentives; Fishers

Tuesday, January 10, 2017

Examining the ecosystem service of nutrient removal in a coastal watershed

Highlights
...
• The Piscataqua-Salmon Falls watershed community needs to address wastewater treatment plants.
• Conservation could reduce 3–28 t/yr of Nitrogen, worth 10–50 million dollars over ten years.
• Even under high conservation removal estimates of 28.1 ton/yr, point source reductions are needed.

Abstract
Globally, managers are trying to prevent or halt the eutrophication of valuable estuaries and bays by reducing nutrient inputs, but justifying the cost of conservation or processing facility upgrades often proves challenging. We focus on a coastal watershed in Maine and New Hampshire struggling with the financial burdens of nitrogen pollution mandates due to the eutrophication of the Great Bay estuary. After creating two future watershed land cover scenarios comparing plausible extremes, we ran them through two models, the Natural Capital Project’s InVEST (Integrated Valuation of Ecosystem Services and Tradeoffs) and a detailed hydrologic and biogeochemical river network model FrAMES (Framework for Aquatic Modeling of the Earth System). Through this work, we both evaluated and valued the ecosystem service of nitrogen retention. We find that both models provide numerical arguments for conservation efforts, and decision makers would benefit from using either an ecosystem services model or a biogeochemical model when dealing with complex issues like nutrient overenrichment. According to both our modeling results, modest watershed conservation efforts as defined by our expert stakeholders, ie: protecting wetlands and forests, could reduce the amount of total nitrogen entering the Great Bay estuary in the range of 3–28 metric tons per year.
aerial shot of Little Bay and Great Bay
by Chelsea E. Berg 1, Madeleine M. Mineau 2 and Shannon H. Rogers 1 
1. Center for the Environment, Plymouth State University, United States MSC 63 17 High Street, Plymouth, NH 03264, United States.
2. Earth Systems Research Center, University of New Hampshire, Durham, NH, USA
Ecosystem Services http://www.sciencedirect.com/science/journal/22120416 via Elsevier Science Direct www.ScienceDirect.com
Volume 22, Part B, December 2016, Available online 24 December 2016; Pages 309–317
Special Issue: Integrated valuation of ecosystem services: challenges and solutions
Keywords: Ecosystem service valuation; Nutrient retention; InVEST; Great Bay; Avoided cost analysis; FrAMES

Estimating the value of ecosystem services in a mixed-use watershed: A choice experiment approach

Highlights
• Location and costs are significant explanatory variables of MWTP.
• Annual household income was associated with ecosystem services preferences.
• The average MWTP for ecosystem services was extremely low (<$2/household/year)
• A dissociation between local needs and global issues explains the overall low valuations.
Abstract
The protection of water, land, and air resources has profound implications for the sustainability of ecosystem services provided to societies that are embedded within economies, global systems, and socio-cultural and political contexts. This study assessed preferences for provisioning, regulating, and supporting ecosystem services, specifically, climate regulation (carbon sequestration), nutrient control (water quality), and agricultural and forest productivity, and the willingness to pay for protection of these ecosystem services by residents in the Suwannee River Basin of Florida, as assessed through a household mail survey and choice experiment. A conditional logit model was used to evaluate preferences and marginal willingness to pay (MWTP) under different scenarios. Survey respondents identified nutrient control (water quality) as the most important service, while agricultural and forestry production was somewhat important, and climate regulation/carbon sequestration was the least important. Respondents expressed the highest level of trust in local government agencies to implement ecosystem service protection programs, and welcomed the implementation of such programs anywhere in the basin, but not close to their home. The average MWTP was extremely low (<$2/household/year) when compared to other studies, and suggests that respondents have many competing interests for their discretionary spending in relation to environmental amenities.
Suwannee River.jpg
Pasicha Chaikaew 1 and 3, Alan W. Hodges 2 and Sabine Grunwald 3 
1. Department of Environmental Science, Chulalongkorn University, Bangkok 10330, Thailand
2. Department of Food and Resource Economics, University of Florida, Gainesville, FL 32611, USA
3. Department of Soil and Water Science, University of Florida, Gainesville, FL 32611, USA
Ecosystem Services via Elsevier Science Direct www.ScienceDirect.com
Volume 23; February, 2017; Pages 228–237
Keywords: Ecosystem services; Choice experiments; Willingness to pay; Preferences

Sunday, December 18, 2016

Planning for green infrastructure: The spatial effects of parks, forests, and fields on Helsinki's apartment prices

Highlights
• Spatial effects of forests, parks, and fields on apartment prices are estimated.
• Forests generate indirect benefits in the urban core and direct in the urban fringe.
• Parks generate direct and indirect benefits in the urban core.
• Fields generate direct benefits in the urban fringe and no indirect spillovers.
• Successful green interventions are location-, benefit-, and goal-sensitive.

Abstract
As the importance of urban green spaces is increasingly recognised, so does the need for their systematic placement in a broader array of socioeconomic objectives. From an urban planning and economics perspective, this represents a spatial task: if more land is allocated to various types of green, how do the economic effects propagate throughout urban space? This paper focuses on the spatial marginal effects of forests, parks, and fields and estimates spatial hedonic models on a sample of apartment transactions in Helsinki, Finland. The results indicate that the capitalization of urban green in apartment prices depends on the type of green, but also interacts with distance to the city centre. Additionally, the effects contain variable pure and spatial spillover impacts, also conditional on type and location, the separation of which highlights aspects not commonly accounted for. The planning of green infrastructure will therefore benefit from parameterizing interventions according to location, green type, and character of spatial impacts.
...
The full-sample estimation explained 78% of price variation and returned the expected signs for all hedonic coefficients, except for that of distance to a forest. An increase in the debt and maintenance costs and a decrease in the condition of the property decreases price/m2. Additional rooms have a negative effect, reflecting the diminishing marginal utility of additional units of space. Increase in the property's age decreases price until historical status becomes relevant and price increases again. The yearly dummy variables are significant, indicating a drop in the average level of selling price/m2 from 2000 to 2001, followed by an increase from 2002 onwards. Increased distance to the city centre and coastline decrease price, whereas lot size is not significantly different from zero. The coefficients of the proxies for noise and air pollution disamenities are significant; a 100-meter increase in distance to rails increases average m2 price by 0.15%, while the corresponding increase for over-ground metro line is 0.19% and for major road is 0.36%.
Kuva: Roy Koto/ Viherosasto

The estimation supported the assumption of a CBD gradient in the marginal effects of parks and fields. Increased distance to a park decreases prices in the city centre, or, conversely decreasing the distance of a downtown property to a park increases its price, with the effect gradually declining as distance to the CBD increases. The maximum effect is estimated to a decrease of 1.5% in the m2 price when distance to a park increases 100 m, which is in the same range to the effect of recreational forests in the study of Tyrväinen (1997) that reports a corresponding increase of 0.5% (after currency conversion and average price normalization).... Increased distance to fields decreases price in the urban fringe, or conversely, decreasing the distance of a suburban property to fields increases its price. The maximum effect along this gradient is a decrease of 1.1% in m2 price when distance to a field increases by 100 m.

Going to the Woods Is Going Home: Recreational Benefits of a Larger Urban Forest Site — A Travel Cost Analysis for Berlin, Germany

Highlights
• The travel cost method (TCM) is applied to an urban forest site in Berlin, Germany.
• The study strongly suggests the feasibility of the TCM for urban forest sites.
• Recreational demand is less elastic for Berlin residents than for non-residents.
• Online survey participants show a more elastic demand than those sampled on-site.
• An overall consumer surplus of 14.95 € per visit is estimated for the whole sample.

Abstract
We present an application of the travel cost method to a large urban forest site in Berlin, Germany. The analysis is based on a large onsite survey and the same survey administered online. Although such applications are rare in an urban context, applying a seasonal demand model to the case of Grunewald is possible because the distances travelled are relatively large, the majority of the respondents use motorized or public transport, and Grunewald is a large and unique urban forest site with very few substitutes. The main results are the following: (1) The demand for visits to Grunewald is less elastic if only Berlin residents are taken into account compared to when residents from the entire larger urban area of Berlin are considered. (2) Estimated consumer surpluses are therefore greater if only Berlin residents are taken into consideration. (3) In addition, demand is more elastic for the internet sample than for the on-site sample. (4) Results suggest a lower bound overall consumer surplus of 14.95 € per visit. The results indicate that despite its inherent limitations, non-market economic valuation through the travel cost method can provide administrations with a powerful tool to monetize the benefits of urban forest recreation to increase public funding and redirect resources to address intensified use....

Saturday, December 17, 2016

A Global Survey and Review of the Determinants of Transaction Costs of Forestry Carbon Projects

Highlights
• We measured transaction costs incurred by project developers of forestry carbon in monetary and non-monetary terms.
• We tested if the transaction costs depend on characteristics of the transaction, transactor, and institutional design.
• TCs are found to be significantly influenced by various factors, especially market type.
• CDM-market-related projects face significantly higher TCs than non-CDM-related projects.

Abstract
Reducing carbon emissions in the forestry sector by means of market-based schemes is considered a cost-effective measure for tackling climate change impacts. However, the transaction costs (TCs) involved are typically unknown or unquantified and therefore often neglected. In this study three types of TCs (search, design and negotiation costs) were measured in person-days and monetary terms based on a global survey of forestry carbon projects implemented across Latin-America, Asia and Africa. Cost estimates vary between zero and 1.201/tCO2 for person-days and from zero to US$ 1.738/tCO2 for monetary costs. Key drivers of TCs are identified based on the characteristics of the project in general, the transaction, the transactors involved and institutional design. The latter type of characteristic is shown to have a particularly large impact on TCs.

by Thu-Ha Dang Phan 1 and 2, Roy Brouwer 2 and Marc David Davidson 1 
1. Institute for Biodiversity and Ecosystem Dynamics, University of Amsterdam, P.O. Box 94248, 1090 GE Amsterdam, The Netherlands
2. Department of Economics, University of Waterloo 200 University Avenue West, Waterloo, ON, N2L 3G1, Canada
Ecological Economics via Elsevier Science Direct www.ScienceDirect.com
Volume 133; March, 2017; Pages 1–10
Available online 24 November 2016
Keywords: Transaction costs; Institutional design; Forestry carbon; REDD; CDM; Carbon market

Sunday, November 13, 2016

Valuing hypothetical wildfire impacts with a Kuhn–Tucker model of recreation demand

Abstract
This study uses a nonmarket valuation method to investigate the recreation values of the San Jacinto Wilderness in southern California. The analysis utilizes survey data from a stated-choice experiment involving backcountry visitors who responded to questions about hypothetical wildfire burn scenarios. Benefits of landscape preservation are derived using a Kuhn–Tucker (KT) demand system. Model results suggest that recreationists are attracted to sites with recent wildfires that can be viewed up-close. For example, recreational welfare estimates increased for sites that were partially affected by different types of wildfires, with the greatest gains being observed for the most recent wildfires. Per person mean seasonal willingness-to-pay varied from a low of $10 to a high of $48, for total gains ranging from $62,223 to $635,286. However, wildfires that cause trail closures create welfare losses. Seasonal losses per person for complete closure of particular sites range from $3 to $221, for total losses ranging from $29,600 to $2.9 million.
File:Wildfire in California.jpg
Highlights
• Analysis uses survey data from a stated-choice experiment involving backcountry visitors.
• Recreationists are attracted to sites with recent low intensity wildfires that can be viewed up-close.
• Recreational welfare estimates increased for sites that were partially affected by different types of wildfires.
• Wildfires that cause trail closures create welfare losses.

http://www.sciencedirect.com/science/article/pii/S1389934115300319
by José J. Sánchez 1, Ken Baerenklau 2, Armando González-Cabán 1
1. USDA Forest Service, Pacific Southwest Research Station, 4955 Canyon Crest Drive, Riverside, CA 92507, USA
2. University of California, Riverside, Riverside, CA 92521, USA
Forest Policy and Economics http://www.sciencedirect.com/science/journal/13899341 via Elsevier Science Direct www.ScienceDirect.com
Volume 71, October 2016, Pages 63–70;
Keywords: Kuhn–Tucker demand system model; Forest recreation value; Hypothetical burn scenarios; Web-based survey; Nonmarket valuation
☆ This article is part of a special issue entitled “Integrating ecosystem service concepts into valuation and management decisions" published in Forest Policy and Economics 71, 2016.

Sunday, October 30, 2016

Willingness to pay for ecosystem conservation in Alaska’s Tongass National Forest: a choice modeling study

Abstract:
Forest ecosystems contribute to human welfare in important ways, but because of the nonmarket nature of many of the goods and services produced, both markets and governments fail to optimize their production commensurate with their economic and ecological significance. Despite the recent proliferation of nonmarket environmental valuation in the literature, the incorporation of nonmarket values into public forest decision making has been limited by institutional and methodological barriers. To address this disconnect, we conducted a case study to quantify conservation values for the Tongass National Forest in a manner conducive for public forest planning. A choice experiment featuring proposed forest management alternatives with changes in critical attributes relative to their levels in the status quo was used to generate the requisite data. Econometric analysis suggests that Alaskans have strong preference for conservation management, including both preservation and ecological restoration, over status quo or exploitation management. However, there is significant heterogeneity among Alaskans in terms of bias toward the status quo depending on their socioeconomic characteristics, e.g., gender, age, place of residence, household income, whether or not they have dependent children. The findings of this study can be helpful to forest managers in the preparation of resource management plans consistent with maximization of total economic value of forest ecosystem services.
...
Discussion and Conclusions
The objective of this study was to use best practices for designing a choice experiment most applicable for forest planning and management to measure WTP for conservation programs on the Tongass. The mean WTP for 50% old-growth preservation (US$147 2012) is consistent with the mean preservation values found in a meta-analysis (Hjerpe et al. 2015) of global ecosystem conservation (US$131 2010). Estimation results based on random parameter logit show that household WTP varies depending on the attribute and specific level. However, there are important differences in how respondents value different levels of each attribute. In particular, the scope effect seems to hold for old-growth preservation and watershed restoration attributes (with the 100% level preferred more than 50% level), but does not for the second-growth forest restoration attribute. For this attribute the coefficient on 100% is much smaller than the corresponding coefficient on 50% level. This valuation pattern suggests that Alaskans hold significant values for nontimber outputs because the background information provided to them on old growth preservation explicitly stated that the benefits would be of nontimber type and would entail the loss of timbering jobs on these acres. Yet, the smaller program WTP for a 100% increase in all noncost attributes compared with a 50% means that Alaskans’ support for conservation has a threshold and is diminished past a certain point....
View overlooking green trees and water
by Evan E. Hjerpe 1 and Anwar Hussain 1 and2
1. Conservation Economics Institute
2. Forest Policy Center, Auburn University
Ecology and Society www.ecologyandsociety.org
Volume 21, Number 2; 2016; Article 8

Friday, July 8, 2016

Cash for Carbon: A Randomized Controlled Trial of Payments for Ecosystem Services to Reduce Deforestation

Abstract:
This paper evaluates a Payments for Ecosystem Services (PES) program in western Uganda that offered forest-owning households cash payments if they conserved their forest. The program was implemented as a randomized trial in 121 villages, 60 of which received the program for two years. The PES program reduced deforestation and forest degradation: Tree cover, measured using high-resolution satellite imagery, declined by 2% to 5% in treatment villages compared to 7% to 10% in control villages during the study period. We find no evidence of shifting of tree-cutting to nearby land. We then use the estimated effect size and the "social cost of carbon" to value the delayed carbon dioxide emissions, and compare this benefit to the program's cost. 
...
Addressing deforestation in developing countries is, thus, a key pillar of international climate policy. REDD+ (Reducing Emissions from Deforestation and Forest Degradation) is a United Nations mechanism through which developing countries are rewarded financially for preservation of forestland; annually, about $500 million dollars flow to developing countries (Silva-Ch´avez, Schaap, and Breitfeller, 2015). The Paris Agreement negotiated in 2015 bolstered the role of REDD+ in climate policy (United Nations FCCC, 2015).
...
Over the two-year pilot program from 2011 to 2013, for each hectare of forest they owned, enrollees received 70,000 Ugandan shillings (UGX), or $28 in 2012 US dollars, per year if they complied with the contract. The implementing NGO employed forest monitors who conducted spot checks of enrollees’ land to check for recent tree-clearing. The program also offered additional payments in exchange for planting tree seedlings.
...
File:Kibale, Uganda.jpg
We estimate that for each $0.25 in payments, or $0.57 in total program costs, a ton of CO2 emissions due to deforestation was delayed. We then calculate the externality benefit of the delayed emissions, using a “social cost of carbon” (SCC) of $39 (in 2012 US dollars) per ton (Interagency Working Group on Social Cost of Carbon, 2013). The SCC is the benefit of permanently averting CO2 emissions, while this 2-year program’s benefit was to delay deforestation and emissions. To quantify the delay, we need to make assumptions about deforestation after the program ends, which we do not observe in our data. Our base case scenario assumes PFOs deforest at a 50% higher rate than usual after the program ends, converging to the control group after four years. The social benefit of the delayed CO2 emissions is then $1.11 per ton, or roughly 2 times the $0.57 program cost.

We repeat the calculation for a range of assumptions. At one extreme, if PFOs catch up on their backlog of avoided deforestation the moment the program ends, the benefitcost ratio falls to 0.7. At the other extreme, if PFOs pause their deforestation during the intervention and then resume deforesting at their typical rate, not an accelerated rate, after the program ends, then the benefit cost-ratio rises to 12.3. This last scenario, which represents a permanent delay in deforestation, is the most relevant one for extrapolating to a permanent or longer-duration program.
 
...
On average, revenue from timber products in the previous year is 110,000 UGX or $44....per PFO who enrolled, the average payment was $113 ($36 ÷ 31.9%)... in the treatment group, total revenue from timber products is lower by 2.89 million UGX ($116), or 23 log points, and there is a 4 percentage point (27%) lower likelihood of receiving any revenue from timber in the past year.
...
Monitoring costs were $88 per program enrollee, or $28 per eligible PFO. We assume an additional cost per eligible PFO of $30 for marketing of the program and overall program management. We further assume a 10%
transaction fee for PES payments. Combining these assumptions, the administrative costs amount to $0.41 per averted ton of CO2
...;  our best guess of the total program costs at scale-up—incentive payments plus administrative costs—is $0.57 per averted ton of CO2

  
by Seema Jayachandran, Joost de Laat, Eric F. Lambin, Charlotte Y. Stanton
National Bureau of Economic Research (NBER)
NBER Working Paper No. 22378; Issued in June 2016


via/hat tip Chris Mooney http://tinyurl.com/zg4bd9c