Showing posts with label Technology. Show all posts

Wednesday, May 10, 2023

New Vehicle Standards Will Produce Enormous Benefits for Consumers and the Climate

Updated pollution standards for cars and trucks will cut fuel costs and avoid up to a trillion dollars’ worth of climate-related damages

One April 13, 2023, the Environmental Protection Agency proposed new vehicle standards that will significantly reduce emissions of greenhouse gases and other criteria pollutants from the transportation sector. EPA’s multipollutant standards for light- and medium-duty vehicles sold in Model Years 2027 through 2032 will both reduce pollution and save consumers money—generating substantial societal benefits in the process.

Meredith Hankins, Senior Attorney at the Institute for Policy Integrity at NYU School of Law, issued the following statement: “EPA has a long history of using ambitious emission standards to protect public health, and today’s proposal adds to that history. The proposed standards for passenger vehicles are estimated to result in up to $1 trillion dollars in climate benefits, $280 billion in health benefits from reducing other pollution, and up to $770 billion in avoided fuel costs for consumers. This proposal, and the companion proposal for heavy-duty vehicles, recognize automotive manufacturers’ own commitments to electrify their fleets and build on Congressional incentives in the Inflation Reduction Act. EPA’s proposals represent an achievable path toward increasing the market-share of zero-emission vehicles.”

Relatedly, the Institute for Policy Integrity filed an Amicus Brief Defending NHTSA Corporate Average Fuel Economy Standards on April 4, 2023.  They noted that in May 2022, the National Highway Traffic Safety Administration (NHTSA) finalized a rule to increase its corporate average fuel economy (CAFE) standards for passenger cars and light trucks for model years 2024–2026. A group of fuel and petrochemical manufacturers and states challenged the standards in the U.S. Court of Appeals for the D.C. Circuit, arguing primarily that the Energy Policy and Conservation Act bars NHTSA from including electric vehicles in the analytical baseline for the new standards. Their amicus brief explains that longstanding administrative guidance and case law direct agencies to develop baselines that reflect their best assessment of the real world absent any new agency action. In the context of this rulemaking, that guidance and case law required NHTSA to project how many and what kinds of vehicles—including electric (and plug-in hybrid electric) vehicles—would be built and sold if it did not issue new CAFE standards, which is what NHTSA did here. Their amicus brief also explains that NHTSA has consistently prepared baselines for prior CAFE standards in this manner.

The Institute for Policy Integrity at New York University School of Law, a non-partisan think tank dedicated to improving the quality of government decisionmaking. The institute produces original scholarly research in the fields of economics, law, and regulatory policy; and advocates for reform before courts, legislatures, and executive agencies. https://policyintegrity.org
Press Release dated April 13, 2023
Also see
Multi-Pollutant Emissions Standards for Model Years 2027 and Later Light-Duty and Medium-Duty Vehicles
A Proposed Rule by the Environmental Protection Agency on 05/05/2023
in the Federal Register

Friday, January 8, 2021

Sources of Cost Overrun in Nuclear Power Plant Construction Call for a New Approach to Engineering Design

Highlights
• US nuclear plant cost estimation does not align with observed experience
• “Indirect” expenses, largely soft costs, contributed a majority of the cost rise
• Safety-related factors were important but not the only driver of cost increases
• Mechanistic models inform innovation by relating engineering design to cost change

Summary
Nuclear plant costs in the US have repeatedly exceeded projections. Here, we use data covering 5 decades and bottom-up cost modeling to identify the mechanisms behind this divergence. We observe that nth-of-a-kind plants have been more, not less, expensive than first-of-a-kind plants. “Soft” factors external to standardized reactor hardware, such as labor supervision, contributed over half of the cost rise from 1976 to 1987. Relatedly, containment building costs more than doubled from 1976 to 2017, due only in part to safety regulations. Labor productivity in recent plants is up to 13 times lower than industry expectations. Our results point to a gap between expected and realized costs stemming from low resilience to time- and site-dependent construction conditions. Prospective models suggest reducing commodity usage and automating construction to increase resilience. More generally, rethinking engineering design to relate design variables to cost change mechanisms could help deliver real-world cost reductions for technologies with demanding construction requirements.
...
The history of nuclear energy in the US is one of mixed results. Rapid capacity growth in the 1960s was accompanied by significant unit upscaling, followed by operational improvements and rising capacity factors. But in the 1970s, rising project durations and costs, alongside studies on thermal pollution and low-level radiation, became a source of public controversy. Following the 1979 Three Mile Island accident, a long hiatus of nuclear construction began. Rising construction costs and project delays have continued to affect efforts to expand nuclear capacity in the US since the 1970s. A survey of plants begun after 1970 shows an average overnight cost overrun of 241%. Since the 1990s, two nuclear projects have begun construction, both two-reactor expansions of existing generating stations. The VC Summer project in South Carolina was abandoned in 2017 with sunk costs of $9B, and the Vogtle project in Georgia is severely delayed. Current estimates place the total price of the Vogtle expansion at $25B ($11,000/kW), almost twice as high as the initial estimate of $14B, and costs are anticipated to rise further.

Challenges in nuclear construction are not unique to the US. Recent projects in Finland (Olkiluoto 3) and France (Flamanville 3) have also experienced cost escalation, cost overrun, and schedule delays. Cost estimates for a plant under construction in the United Kingdom (Hinkley Point C) have been revised upward. In contrast to the experience in Western Europe and the US, however, China, Japan, and South Korea have achieved construction durations shorter than the global median since 1990. Cost and construction duration tend to correlate (e.g., Lovering et al.), but it should be noted that cost data from these countries are largely missing or are not independently verified. (Cost data should be provided and audited by entities not actively involved in plant procurement and construction, including data from international organizations or government agencies as opposed to data from utilities and reactor equipment providers.)
[The researchers concluded that between 1976 and 1987, indirect costs—those external to hardware—caused 72% of the cost increase. “Most aren’t hardware-related but rather are what we call soft costs,” says Trancik. “Examples include rising expenditures on engineering services, on-site job supervision, and temporary construction facilities.”]


Percentage contribution of variables to increases in containment building costs These panels summarize types of variables that caused costs to increase between 1976 and 2017. In the first time period (left panel), the major contributor was a drop in the rate at which materials were deployed during construction. In the second period (middle panel), the containment building was redesigned for improved safety during possible emergencies, and the required increase in wall thickness pushed up costs. Overall, from 1976 to 2017 (right panel), the cost of a containment building more than doubled.

As the left and center panels above show, the importance of those mechanisms changed over time. Between 1976 and 1987, the cost increase was caused primarily by declining deployment rates; in other words, productivity dropped. Between 1987 and 2017, the containment building was redesigned for passive cooling, reducing the need for operator intervention during emergencies. The new design required that the steel shell be approximately five times thicker in 2017 than it had been in 1987—a change that caused 80% of the cost increase over the 1976–2017 period.

Wednesday, October 14, 2020

Quantifying the Human Health Benefits of Using Satellite Information to Detect Cyanobacterial Harmful Algal Blooms and Manage Recreational Advisories in U.S. Lakes

Abstract
Significant recent advances in satellite remote sensing allow environmental managers to detect and monitor cyanobacterial harmful algal blooms (cyanoHAB), and these capabilities are being used more frequently in water quality management. A quantitative estimate of the socioeconomic benefits generated from these new capabilities, known as an impact assessment, was missing from the growing literature on cyanoHABs and remote sensing. In this paper, we present an impact assessment framework to characterize the socioeconomic benefits of satellite remote sensing for detecting cyanoHABs and managing recreational advisories at freshwater lakes. We then apply this framework to estimate the socioeconomic benefits of satellite data that were used to manage a 2017 cyanoHAB event in Utah Lake. CyanoHAB events on Utah Lake can pose health risks to people who interact with the blooms through recreation. We find that the availability of satellite data yielded socioeconomic benefits by improving human health outcomes valued at approximately $370,000, though a sensitivity analysis reveals that this central estimate can vary significantly ($55,000–$1,057,000 in benefits) as a result of different assumptions regarding the time delay in posting a recreational advisory, the number of people exposed to the cyanoHAB, the number of people who experience gastrointestinal symptoms, and the cost per case of illness.

by Signe Stroming  Molly Robertson  Bethany Mabee  Yusuke Kuwayama  Blake Schaeffer
Volume 4, Issue 9; September 2020; First published: 18 June 2020 

Tuesday, August 28, 2018

Report Confirms Wind Technology Advancements Continue to Drive Down Wind Energy Prices - Key findings indicate wind energy prices at all-time lows as wind turbines grow larger

Wind energy pricing remains attractive, according to an annual report released by the U.S. Department of Energy and prepared by Lawrence Berkeley National Laboratory (Berkeley Lab). At an average of around 2 cents per kilowatt-hour (kWh), prices offered by newly built wind projects in the United States are being driven lower by technology advancements and cost reductions.

“Wind energy prices ­– ­particularly in the central United States, and supported by federal tax incentives – remain at all-time lows, with utilities and corporate buyers selecting wind as a low-cost option,” said Berkeley Lab Senior Scientist Ryan Wiser of the Electricity Markets & Policy Group.

Key findings from the U.S. Department of Energy’s Wind Technologies Market Report include:

Wind power capacity additions continued at a rapid pace in 2017. Nationwide, wind power capacity additions equaled 7,017 megawatts (MW) in 2017, with $11 billion invested in new plants. Wind power constituted 25 percent of all U.S. generation capacity additions in 2017. Wind energy contributed 6.3 percent of the nation’s electricity supply, more than 10 percent of total electricity generation in 14 states, and more than 30 percent in four of those states (Iowa, Kansas, Oklahoma, and South Dakota).

Bigger turbines are enhancing wind project performance. The average generating capacity of newly installed wind turbines in the United States in 2017 was 2.32 MW, up 8 percent from the previous year and 224 percent since 1998-1999. The average rotor diameter in 2017 was 113 meters, a 4 percent increase over the previous year and a 135 percent boost over 1998-1999, while the average hub height in 2017 was 86 meters, up 4 percent from the previous year and 54 percent since 1998-1999. Permit applications to the Federal Aviation Administration suggest that still-taller turbines are on the way. Increased rotor diameters, in particular, have begun to dramatically increase wind project capacity factors. The average 2017 capacity factor among projects built from 2014 through 2016 was 42 percent, compared to an average of 31.5 percent among projects built from 2004 to 2011, and 23.5 percent among projects built from 1998 to 2001.

Low wind turbine pricing continues to push down installed project costs. Wind turbine equipment prices have fallen to $750-$950/kilowatt (kW), and these declines are pushing down project-level costs. The average installed cost of wind projects in 2017 was $1,610/kW, down $795/kW from the peak in 2009 and 2010.
Wind energy prices remain low. Lower installed project costs, along with improvements in capacity factors, are enabling aggressive wind power pricing. After topping out at 7 cents per kWh in 2009, the average levelized long-term price from wind power sales agreements has dropped to around 2 cents per kWh – though this nationwide average is dominated by projects that hail from the lowest-priced region, in the central United States. Recently signed wind energy contracts compare favorably to projections of the fuel costs of gas-fired generation. These low prices have spurred demand for wind energy from both traditional electric utilities and nonutility purchasers, such as corporations, universities, and municipalities.

The domestic supply chain for wind equipment is diverse. Wind sector employment reached a new high of 105,500 full-time workers at the end of 2017. For wind projects recently installed in the United States, domestically manufactured content is highest for nacelle assembly (more than 90 percent), towers (70 to 90 percent), and blades and hubs (50 to 70 percent). It is much lower (less than 20 percent) for most components internal to the turbine. Although there have been a number of manufacturing plant closures over the last decade, each of the three largest turbine suppliers serving the U.S. market – Vestas, General Electric Co., and Siemens Gamesa – has one or more domestic manufacturing facilities in operation.

The Department of Energy’s release on this study is available at energy.gov/windreport.

Berkeley Lab www.lbl.gov
Press Release dated August 23, 2018

Friday, August 25, 2017

National Renewable Energy Laboratory (NREL) Updates Baseline Cost and Performance Data for Electricity Generation Technologies

The Energy Department's National Renewable Energy Laboratory (NREL) has released the 2017 Annual Technology Baseline (ATB), updating a key source of reliable electricity generation technology cost and performance data used to support and inform electric sector analysis in the United States. Now in its third year, the ATB documents technology-specific information on a broad spectrum of electricity generation technologies, including wind, solar, geothermal, hydropower, biomass, coal, natural gas, and nuclear.
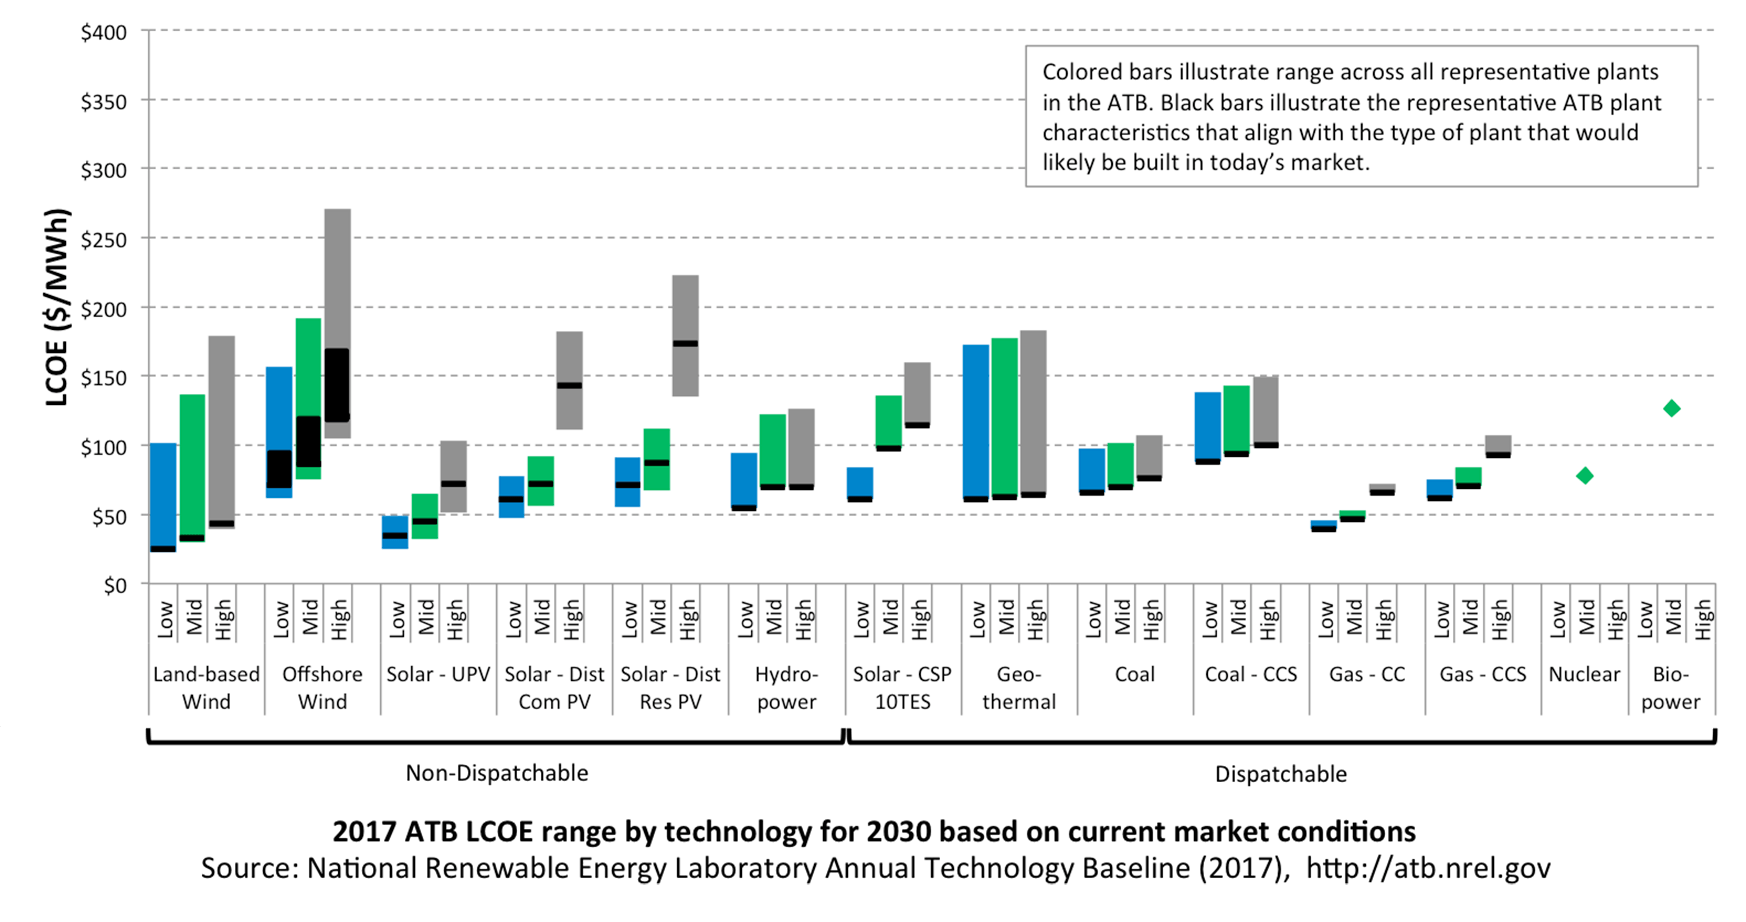
Graph titled 2017 ATB LCOE range by technology for 2030 based on current market conditions.
ATB LCOE range by technology for 2030 based on current market conditions.
Levelized cost of energy LCOE values calculated using macro-economic indicators (e.g., interest rates) estimated for 2017 in the U.S. Energy Information Administration’s Annual Energy Outlook 2017. The ATB focuses on electricity generation technology capital cost, operating costs, and energy production. It does not include time-varying macro-economic indicators. Values shown in 2015 U.S. dollars; hydropower is classified as non-dispatchable because most new hydropower generation would operate in run-of-river mode. LCOE captures the energy component of electric system planning and operation, but the electric system also requires capacity and flexibility services, typically associated with dispatchability, to operate reliably.

The ATB synthesizes current and projected data from various sources into a highly accessible and widely referenced resource for energy analysts. The 2017 ATB is available in a new interactive website at atb.nrel.gov and will be featured in a webinar on August 29.

“In addition to aggregating the most reliable, timely cost and performance data spanning the full range of energy technologies, the Annual Technology Baseline highlights key trends and makes projections out to 2050,” said NREL Senior Analyst Maureen Hand. “For energy analysts and others tasked with communicating relevant electricity technology cost and performance trends that have a bearing on energy markets, the ATB serves as an indispensable go-to resource that greatly facilitates and streamlines the work involved.”

For example, the ATB illustrates how solar photovoltaic (PV) capital costs have declined recently and are projected to continue to decline.  Similarly, land-based wind capital costs have fallen while capacity factors have increased. These are trends that are both projected to continue and make wind increasingly competitive with new generation from natural gas combined cycle plants in the near term.  The ATB provides three different levels of future technology cost and performance through 2050 to support analysis of future U.S. electric sector scenarios.

The ATB, which is supported by the Energy Department's Office of Energy Efficiency and Renewable Energy, incorporates NREL analysis, data from the U.S. Energy Information Administration, and information from a variety of published reports into two primary products for energy analysts. The Annual Technology Baseline spreadsheet documents detailed current and projected cost and performance data for electricity generation technologies. This year, a new interactive website describes each of the technologies and provides additional context for their treatment in the workbook. For each technology, the website provides:

  • Historical trends, current estimates, and future projections of three primary cost and performance factors: capital expenditures, capacity factor, and operations and maintenance cost
  • Documentation of the methodology and assumptions used to develop the projections of future cost and performance under high-, mid-, and low-cost cases
  • A calculated levelized cost of energy to illustrate the combined effect of the primary cost and performance factors.
The Annual Technology Baseline, which is supported by hundreds of literature citations, will be highlighted in a webinar on August 29, at 11 a.m.–1 p.m. MDT (1-3 p.m. EDT). Presenters will describe analytical products in detail, share examples of how they have been used, and provide an opportunity for attendees to ask questions. Register for the webinar at https://attendee.gotowebinar.com/register/4954393182456811522.

Thursday, August 17, 2017

Study: We're Still Underestimating Battery Cost Improvements | Greentech Media

Batteries have been beating expectations in recent years as costs continue to fall.... Berkeley professor Daniel Kammen [has] devised a new model, recently published in Nature Energy ... predicting future cost declines at a pace faster than previous analyses. 

Scholars have modeled clean energy cost declines based on single factors, like annual production or cumulative production. These one-factor models approximate reductions from learning by doing: the more an industry deploys its product, the better it gets at it.  These models have a high explanatory value, but they didn’t see recent battery cost drops coming. They overestimate lithium-ion costs in the 2010-2015 period, the most recent years in the data set Kammen and his colleagues examined.

Their new model explains cost as the function of two variables, production volume and cumulative patents issued under the international Patent Cooperation Treaty.  When the researchers plugged in the latest battery production forecasts, with the assumption that patent activity continues at the average rate from the last five years in the dataset, they found ... lower cost reductions than existing forecasts in the literature.
At the battery pack level, lithium-ion needs to hit the $125 to $165 per kilowatt-hour range to compete with internal combustion engines (based on 2015 gas prices). The two-factor model predicts EV cost-competitiveness will arrive between 2017 and 2020, ... earlier than the previous[ predictions].

The model also covers solar with batteries. If the solar industry U.S. hits the Department of Energy SunShot goal of deploying PV for $1 per watt (which it has for large projects), residential solar-plus-storage will be widely competitive by 2020. The combination would offer a levelized cost of energy of $0.11 per kilowatt-hour.

That would transform residential storage from a niche item for powering wealthy homes during blackouts into a cost-effective investment for anyone who pays a lot for electricity.
...
In one test, the authors scaled down the rate of patent development by one-third. To still beat the energy storage cell cost of $100 per kilowatt-hour by 2020 in this scenario, the industry would need to deploy an additional 307 gigawatt-hours globally.

... Tesla’s Gigafactory aims to produce 35 gigawatt-hours, and it’s not yet completed. Deployment alone is not a practical way to achieve cost declines if scientific innovation drops off.

“At the most extreme case of no new innovation, the opportunity cost of meeting cost reduction targets through deployment alone would be extremely high, in exceedance of $140 billion through 2020,” the authors write. 
   
... The Trump administration has proposed sweeping budget cuts across the Department of Energy, which has traditionally spurred energy innovation through research funding.  Reports surfaced this week of impending layoffs on the order of 525 jobs at the national labs run by the DOE. Labs in that network performed groundbreaking early stage research that led to the commercialization of lithium-ion technology, and continue to break ground on the sort of next generation chemistries that could spur the “learning by innovation” described in Kammen’s model.  “Right when batteries are doing this great stuff, we’re seeing a trail-off in investment,” Kammen said. “We need the Department of Energy to step up, we need the private sector.”.  The DOE retains stronger support in Congress, which ultimately controls the budget.

Lithium-ion costs are following the path of solar, only faster.  “For the same amount of money invested and patents generated, batteries are equal to or ahead of where solar was,” Kammen said.

To keep up that pace, he added, it will be important to maintain a robust research ecosystem with many different labs, companies and universities competing for funds and patents. When money gets concentrated in a few monopolies, they tend to under-innovate.

It also helps that storage has an array of viable technologies, although lithium-ion has dominated the market thus far. This diversity bodes well for continued innovation.

FOR FULL STORY GO TO:
by Julian Spector 
by Julian Spector 
August 17, 2017

Abstract
The clean energy transition requires a co-evolution of innovation, investment, and deployment strategies for emerging energy storage technologies. A deeply decarbonized energy system research platform needs materials science advances in battery technology to overcome the intermittency challenges of wind and solar electricity. Simultaneously, policies designed to build market growth and innovation in battery storage may complement cost reductions across a suite of clean energy technologies. Further integration of R&D and deployment of new storage technologies paves a clear route toward cost-effective low-carbon electricity. Here we analyse deployment and innovation using a two-factor model that integrates the value of investment in materials innovation and technology deployment over time from an empirical dataset covering battery storage technology. Complementary advances in battery storage are of utmost importance to decarbonization alongside improvements in renewable electricity sources. We find and chart a viable path to dispatchable US$1 W−1 solar with US$100 kWh−1 battery storage that enables combinations of solar, wind, and storage to compete directly with fossil-based electricity options.

Thursday, July 7, 2016

World's first eHighway opens in Sweden

On June 22, 2016 the world's first eHighway opened in Sweden.... For the next two years, a Siemens catenary system for trucks will be tested on a two-kilometer stretch of the E16 highway north of Stockholm. The trial will use two diesel hybrid vehicles manufactured by Scania and adapted, in collaboration with Siemens, to operate under the catenary system. "The Siemens eHighway is twice as efficient as conventional internal combustion engines. The Siemens innovation supplies trucks with power from an overhead contact line. This means that not only is energy consumption cut by half, but local air pollution is reduced too," says Roland Edel, Chief Engineer at the Siemens Mobility Division.
Transport accounts for more than one third of Sweden's CO2 emissions, with almost half of that coming from freight transport. As part of its climate protection strategy, Sweden has committed to having a fossil fuel independent transport sector by 2030....

The core of the system is an intelligent pantograph combined with a hybrid drive system. A sensor system enables the pantograph to connect to and disconnect from the overhead line at speeds of up to 90 km per hour. Trucks equipped with the system draw power from the overhead catenary wires as they drive, enabling them to travel efficiently and with zero local emissions. Thanks to the hybrid system, operation outside of the contact line is also possible, thus maintaining the flexibility of conventional trucks. The eHighway technology features an open configuration. As a result, battery or natural gas solutions, for example, can be implemented as an alternative to the diesel hybrid drive system used in Sweden. This allows the system to be adapted flexibly .

Siemens is currently developing another eHighway demonstration project in California. This project is being undertaken in collaboration with vehicle manufacturer Volvo on behalf of the South Coast Air Quality Management District (SCAQMD). Tests will be conducted throughout 2017 to see how different truck configurations interact with the eHighway infrastructure in the vicinity of the ports of Los Angeles and Long Beach.

More information, press photos and footage material are available at http://www.siemens.com/press/ehighway
ith today’s technology, driving a semi-truck 500 miles (804 kilometers) would require a 23-ton lithium-ion battery, half the weight of the truck itself. Fuel cells would need a massive, $2 million hydrogen fuel tank to go the distance. Embedding wireless charging coils in roadbed would be expensive and inefficient.
But an invention first deployed in 1870 to power trains and streetcars might be the perfect fit: catenary, overhead electrical wires commonly found around the world. The German engineering company Siemens, presenting at an electric vehicle conference in Montreal this month, argues it can power unlimited-distance electric trucks with intermittent overhead wires that provide enough energy for fast-moving, long-haul highway journeys.
With on-board batteries added to the trucks, the company estimates all of Germany’s roads could be can be outfitted for long-distance electric hauling with just 4,000 km of wire. Trucks would be able to recharge on highways and operate on battery power while on rural and urban streets. The system would cost a fraction the price of alternatives like hydrogen fuel cells, and deliver as much as €200 billion ($227 billion) in net savings over 30 years compared with other approaches, reports IDTechEx, which attended the presentation.
The technology is ready to go. New advances in catenary systems allow hybrid vehicles to switch seamlessly between overhead charging and battery power at high-speeds. For now, the trucks are diesel hybrids, but extensive overhead wires and efficient batteries would permit the vehicles to eliminate internal combustions engines entirely.
... 

Quartz www.Qz.com
June 22, 2016 
by Michael Coren

Wednesday, February 10, 2016

How predictable is technological progress?

Yale 360 notes:
The cost of manufacturing solar panels is dropping more quickly than previously predicted, putting solar energy on course to meet 20 percent of global energy demand by 2027, according to Oxford University mathematicians, who developed a new forecasting model. By contrast, the International Energy Agency’s predictions are far more conservative, stating that by 2050, solar panels will generate just 16 percent of global energy demand. The Oxford researchers' model predicts solar panel costs will continue to decrease 10 percent a year for the foreseeable future. Their model draws on historical data from 53 different technologies.... said Oxford's Doyne Farmer, who co-wrote the paper. “We put ourselves in the past, pretended we didn’t know the future, and used a simple method to forecast the costs of the technologies,” he said.
...
Highlights
•  A generalized version of Moore's law for unit costs is modelled as a correlated geometric random walk with drift.
•  We study 53 technologies from different sectors.
•  We model forecast errors and empirically test hypotheses about predictability.
•  We apply our method to make forecasts for the price of photovoltaic modules.

Abstract:
Recently it has become clear that many technologies follow a generalized version of Moore's law, i.e. costs tend to drop exponentially, at different rates that depend on the technology. Here we formulate Moore's law as a correlated geometric random walk with drift, and apply it to historical data on 53 technologies. We derive a closed form expression approximating the distribution of forecast errors as a function of time. Based on hind-casting experiments we show that this works well, making it possible to collapse the forecast errors for many different technologies at different time horizons onto the same universal distribution. This is valuable because it allows us to make forecasts for any given technology with a clear understanding of the quality of the forecasts. As a practical demonstration we make distributional forecasts at different time horizons for solar photovoltaic modules, and show how our method can be used to estimate the probability that a given technology will outperform another technology at a given point in the future.
...
Over the last 150 years the inflation-adjusted price of coal has fluctuated by a factor of three or so, but shows no long term trend, and indeed from the historical time series one cannot reject the null hypothesis of a random walk with no drift2 (McNerney et al., 2011). Nuclear power and solar photovoltaic electricity, in contrast, are both new technologies that emerged at roughly the same time. The first commercial nuclear power plant opened in 1956 and the first practical use of solar photovoltaics was as a power supply for the Vanguard I satellite in 1958. The cost of electricity generated by nuclear power is highly variable, but has generally increased by a factor of two or three during the period shown here. In contrast, a watt of solar photovoltaic capacity cost $256 in 1956 (Perlin, 1999) (about $1910 in 2013 dollars) vs. $0.82 in 2013, dropping in price by a factor of about 2330. Since 1980 photovoltaic modules have decreased in cost at an average rate of about 10% per year.
A comparison of long-term price trends for coal, nuclear power and solar ...
Forecast for the cost of photovoltaic modules in 2013 $/Wp. The point forecasts ... 
The prediction says that it is likely that solar PV modules will continue to drop in cost at the roughly 10% rate that they have in the past. Nonetheless there is a small probability (about 5%) that the price in 2030 will be higher than it was in 2013.
 ...
An analysis of coal-fired electricity, breaking down costs into their components and examining each of the trends separately, has been made by McNerney et al. (2011). They show that while coal plant costs (which are currently roughly 40% of total cost) dropped historically, this trend reversed circa 1980. Even if the recent trend reverses and plant construction cost drops dramatically in the future, the cost of coal is likely to eventually dominate the total cost of coal-fired electricity. As mentioned before, this is because the historical cost of coal is consistent with a random walk without drift, and currently fuel is about 40% of total costs. If coal remains constant in cost (except for random fluctuations up or down) then this places a hard bound on how much the total cost of coal-fired electricity can decrease. Since typical plants have efficiencies the order of 1/3 there is not much room for making the burning of coal more efficient – even a spectacular efficiency improvement to 2/3 of the theoretical limit is only an improvement of a factor of two, corresponding to the average progress PV modules make in about 7.5 years. Similar arguments apply to oil and natural gas.
Because historical nuclear power costs have tended to increase, not just in the US but worldwide, even a forecast that they will remain constant seems optimistic. Levelized costs for solar PV powerplants in 2013 were as low as 0.078–0.142 Euro/kWh (0.09–0.16$) in Germany (Kost et al., 2013),27 and in 2014 solar PV reached a new record low with an accepted bid of $0.06/kWh for a plant in Dubai.28 When these are compared to the projected cost of $0.14/kWh in 2023 for the Hinkley Point nuclear reactor, it appears that the two technologies already have roughly equal costs, though of course a direct comparison is difficult due to factors such as intermittency, waste disposal, insurance costs, etc.
...
As a final note, skeptics have claimed that solar PV cannot be ramped up quickly enough to play a significant role in combatting global warming. A simple trend extrapolation of the growth of solar energy (PV and solar thermal) suggests that it could represent 20% of the energy consumption by 2027. In contrast the “hi-Ren” (high renewable) scenario of the International Energy Agency, which is presumably based on expert analysis, assumes that PV will generate 16% of total electricity in 2050. Thus even in their optimistic forecast they assume PV will take 25 years longer than the historical trend suggests (to hit a lower target).
by J. Doyne Farmer 1, 2 and 3, , François Lafonda, 1, 4 and 5
1. Institute for New Economic Thinking at the Oxford Martin School, University of Oxford, Oxford OX2 6ED, UK
2. Mathematical Institute, University of Oxford, Oxford OX1 3LP, UK
3. Santa-Fe Institute, Santa Fe, NM 87501, USA
4. London Institute for Mathematical Sciences, London W1K 2XF, UK
5. United Nations University – MERIT, 6211TC Maastricht, The Netherlands
Research Policy via Elsevier Science Direct www.ScienceDirect.com
Volume 45, Issue 3; April, 2016; Pages 647–66; Available online 6 January 2016
Keywords: Forecasting; Technological progress; Moore's law; Solar energy
via/hat tipe NYU School of Law Institute for Policy Integrity http://policyintegrity.org/ and Yale e360 Digest http://tinyurl.com/gryz75b

Thursday, January 21, 2016

Knowledge Diffusion, Endogenous Growth, and the Costs of Global Climate Policy

Abstract:
This paper examines the effects of knowledge diffusion on growth and costs of climate policy. We develop a general equilibrium model with endogenous growth which represents knowledge diffusion between sectors and regions. Knowledge diffusion depends on accessibility and absorptive capacity which we estimate econometrically using patent and citation data. Knowledge diffusion leads to a “greening” of economies boosting productivity of “clean” carbon-extensive sectors. Knowledge diffusion lowers the costs of global climate policy by about 90% for emerging countries (China) and 20% for developed regions (Europe and USA), depending on the substitutability between different knowledge types.   
 ...
The impacts of knowledge spillovers on economic growth are substantial, corresponding to welfare gains for the global economy of about 4-10%; they depend on the substitutability between different types of knowledge. Regions with initially relatively low knowledge (e.g., China) benefit the most from knowledge diffusion whereas developed regions (e.g., Europe and U.S.) gain relatively less. In line with previous analyses (Eaton and Kortum, 1999; Keller, 2002), we find that the major sources of technical change leading to productivity growth are not domestic but, instead, lie abroad: international knowledge spillovers account for two thirds of the increase in knowledge capital due to knowledge diffusion, domestic spillovers contribute one third.
...
© Climate Tech Wiki - acc and respective owners

by  Lucas Bretschger 1, Filippo Lechthaler 2, Sebastian Rausch 3, and Lin Zhang 4 all of ETH Zurich, Switzerland
ETH Zurich Economic Working Paper 15/226; December, 2015

Saturday, January 9, 2016

Waterless toilet uses nanotechnology to treat waste, banish smells

A toilet that does not need water, a sewage system or external power but instead uses nanotechnology to treat human waste, produce clean water and keep smells at bay is being developed by a British university.

The innovative toilet uses a rotating mechanism to move waste into a holding chamber containing nano elements. The mechanism also blocks odours and keeps waste out of sight.

"Once the waste is in the holding chamber we use membranes that take water out as vapour, which can then be condensed and available for people to use in their homes," Alison Parker, lead researcher on the project, told the Thomson Reuters Foundation.

"The pathogens remain in the waste at the bottom of the holding chamber, so the water is basically pure and clean."

Cranfield University is developing the toilet as part of the global "Reinvent the toilet Challenge" launched by the Bill and Melinda Gates Foundation.

Nanotechnology is the science of creating and working with materials about one nanometer wide, or one-billionth of a metre. A human hair is about 80,000 nanometres wide.

Parker said that despite "significant" interest from developed countries, the toilet is being designed with those in mind who have no access to adequate toilets.

According to the U.N. children's agency UNICEF and the World Health Organization (WHO) 2.4 billion people, mostly in rural areas, live without adequate toilets.

Poor sanitation is linked to transmission of diseases such as cholera, diarrhoea, dysentery, hepatitis A, typhoid and polio, the WHO says.

Cranfield University says its toilet is designed for a household of up to 10 people and will cost just $0.05 per day per user.

A replaceable bag containing solid waste coated with a biodegradable nano-polymer which blocks odour will be collected periodically by a local operator, it says.

Initial field testing of the toilet is likely to take place later this year, Parker said.

by Magdalena Mis, editing by Tim Pearce
Thomson Reuters Foundation www.Trust.org, the charitable arm of Thomson Reuters, that covers humanitarian news, women's rights, corruption and climate change.
January 7, 2016

Friday, February 20, 2015

Levelized Cost of Most Recent Contracts for New Wind Capacity in Michigan down 50% from 2010 - Weighted Average Price of Existing Renewable Energy Contracts Significantly Lower than Cost of Coal-Fired Plants

On February 13, 2015 The Michigan Public Service Commission (MPSC) issued its fifth annual report on the implementation of the state's renewable energy standard and its cost effectiveness.  Public Act 295 of 2008 (PA 295) requires the report to be issued by Feb. 15 each year.

For 2013, the estimated renewable energy percentage reached 7.8 percent, up from 5.4 percent in 2012.  For 2014, renewables are expected to have reached 8.1 percent. 

"By the end of the year, Michigan will have reached its renewable energy portfolio standard (RPS) - 10 percent by 2015," said MPSC Chairman John D. Quackenbush.  "The RPS can be credited with over 1,450 megawatts (MW) of new renewable energy projects becoming commercially operational since PA 295 took effect."

Highlights of the report include the following:  
  • Michigan's electric providers are on track to meet the 10 percent renewable energy requirement.
  • All of Michigan's electric providers accomplished the second compliance requirement successfully for 2013.
  • At the end of 2013, both Consumers Energy and DTE Electric obtained MPSC approval of power purchase agreements and company-owned renewable energy projects that provide the necessary capacity to exceed the 2015 legislative capacity requirements.
  • In July 2014, Consumers Energy reduced its renewable energy surcharge to zero for all customers. In January 2014, DTE Electric company implemented a surcharge reduction, which lowered the residential surcharge from $3 per meter per month to 43 cents.
  • At the end of 2014, there were over 1,500 MW of utility-scale wind projects in operation in Michigan. (This includes 127 MW of utility-scale projects that began operating prior to the Act.)
  • During 2014, five utility-scale wind farms became commercially operational in Michigan.
  • The growth of wind in Michigan's REC portfolio has been significant, increasing from 24 percent in 2012 to 44 percent in 2014.
  • The most recent contracts approved by the MPSC for new wind capacity have levelized costs in the lower $50s per MWh ranges, about 10 percent less than the cheapest levelized contract prices from 2011, and 50 percent of the levelized cost of the first few renewable energy contracts approved in 2009 and 2010.
  • The weighted average price of existing renewable energy contracts is $76.55 per megawatt-hour (MWh), significantly lower than the cost of coal-fired generation plants.
  • On a combined basis (renewable energy and energy optimization), the cost of $37 per MWh is less than any new generation, including new natural gas combined cycle plants, when compared to the Energy Information Administration levelized plant costs for 2014.
  • Some $2.9 billion has been invested to bring approximately 1,450 MW of new renewable energy projects online through 2014 in Michigan.
http://www.baycounty-mi.gov/EACD/WindEnergy.aspx
The entire report is available online, here.

Michigan Public Service Commission (MPSC) www.michigan.gov/mpsc
Press Release dated February 13, 2015
via/hat tip http://www.nawindpower.com/e107_plugins/content/content.php?content.13938