Showing posts with label Hedonic Valuation. Show all posts

Friday, June 9, 2023

Tree cover and property values in the United States: A national meta-analysis

Abstract
[A meta-analysis by Kent Kovacs, Grant West, David J. Nowak and Robert G. Haight] uses 21 hedonic property value studies and 157 unique observations to study the influence of tree cover on the value of homes in the United States. The authors construct elasticity estimates of the percentage change in home value for a 1% change in the percentage of tree cover around a home. Cluster weighted averages of the elasticities account for the housing market and the precision of the property price effects for tree cover on and off property and for three categories of tree cover density. Meta-regression models further control for the housing market and tree cover heterogeneity, the methodological techniques of the primary study, and publication bias. The Mundlak meta-regression model with controls for US regions has the lowest out-of-sample transfer error. The larger elasticity for off property tree cover than on property tree cover (unless tree density is 10% or lower) suggests that the property value of homes rises more if tree cover is not on land that homeowners are responsible for maintaining. The elasticity in neighborhoods with greater than 25% tree cover (0.013) is four times larger than the elasticity in neighborhoods with 0 to 10% tree cover (0.003).
...
Their Mundlak model 2 predicts an $8.88 increase in the value of a single-family home in the Midwest for an on-property increase in tree cover of 0.18%.6 Assuming that the single-family home is on a half-acre lot (21,780 ft2) with an average tree cover of 18% (3920 ft2) (Table 2), they find that a 1% increase in the percentage tree cover amounts to an increase of 39 ft2. Suppose that a 24-in. dbh green ash tree has a crown radius of 35 ft. and a crown area of 962 ft2. A 1% increase in tree cover is equivalent to 0.04 additional 24-in. green ash trees on the property (39/962 = 0.04). The increase in property value for one green ash tree on the property is $8.88/0.04 = $222. Their Mundlak model 2 also predicts a $76.2 increase in the value of a single-family home in the Midwest for a 0.18% increase in tree cover within a mile of the home. A circular area with 1-mile radius has 87.6 million ft2. Using the average tree cover of 18% (Table 2), they find that trees cover 15.8 million ft2, and a 1% increase in the percentage tree cover amounts to an increase of 158,000 ft2. Suppose again a 24-in. dbh green ash tree has a crown radius of 35 ft. and a crown area of 962 ft2. A 1% increase in tree cover is equivalent to 164 additional 24-in. dbh green ash trees within a mile of the home (158,000/962 = 164).
https://www.nature.org/en-us/what-we-do/our-priorities/build-healthy-cities/cities-stories/benefits-of-trees-forests/
What is the total value of a 1% increase in tree cover in a neighborhood? Here, [they] need to calculate the increase in value of all the homes in the neighborhood, and so [they] need an estimate of housing density. According to the 2019 US Census, there are 2,176 households per square mile in St. Paul, MN. If we assume the neighborhood is a circular mile in size, then there are 2176 * 3.14 = 6833 homes in the neighborhood (there are 3.14 mile2 in a circular mile). If each home benefits from the 1% increase in tree cover in the circular area, then the aggregate increase in property value is 6833 * $76.2 = $520,675, for the off-property component of the tree cover. In addition, the aggregate increase in property value is 164 * $222 = $36,408 for the on-property component of tree cover, again assuming the 1% increase in tree cover is composed of 164 24-in. dbh ash trees. Adding those two components, the total value of a 1% increase in tree cover in the circular mile area is $557,083 or $277 per acre of land.

by Kent Kovacs, Grant West, David J. Nowak and Robert G. Haight
Ecological Economics via Elsevier Science Direct www.Sciencedirect.com
Volume 197, July 2022, 107424

Tuesday, May 23, 2023

Sustainability transitions of contaminated sites: A global meta-analysis on economic effects of remediation behaviour

Abstract:
The worldwide diversity of contaminated sites, coupled with a scarcity of available land presents a challenge for urban spatial planning and, has led to an increasing political significance for brownfield conservation and reuse to achieve land resource sustainability. In this study, economic or the so-called ‘rebound effects’ of land regeneration are studied via a global meta-analysis on value fluctuation of surrounding property. To this end, a total of 91 observations from 28 HPM (hedonic pricing model) studies were synthesized to conduct a meta-analysis following a conditional random effects procedure. The empirical results indicate that, in line with expectations, the conservation and recycling of land resource indeed generate significant rebound in the implicit price of residential houses, especially for those located within 2 km of contaminated sites. Before land remediation and reuse, dwellings closest in distance to contaminated sites experience the greatest value loss. On average, the depreciation in property values within the first 1 km distance from a contaminated site is about 8.18%, significantly at the 1% level, while the corresponding adverse impact from 1 to 2 km distance is a 4.8% price premium significantly at the 5% level. The significance of the stigma or rebound effects depends on 12 attributes, in which, house age, location, floor area ratio (FAR), and central business district (CBD) variables have the largest impact of −37.38% to 37.5%. From a practical perspective, the findings of this meta-analysis: (1) help refine contributing parameters in HPM studies to evaluate environmental economics; and (2) provide meaningful decision-making support for cost-effective remediation and benefit maximization.
by Xiaonuo Li, Shiyi Yi, Andrew B. Cundy and Weiping Chen
Land Degradation & Development via Wiley Online https://onlinelibrary.wiley.com/journal/1099145x
Volume 33, Issue11; 15 July 2022; Pages 1775-1786

Monday, May 22, 2023

An Analysis of U.S. Multi-Family Housing, Eco-Certifications, & Walkability

Abstract:
This paper examines the persistence of differentiated pricing in the multi-family housing related to eco-certification. In examining a sample of market rents for non-specialty, multi-family properties both across the U.S., as well as those areas that enjoy the highest concentrations of LEED certified apartments, Jeremy Gabe, Karen McGrath, Spenser Robinson and Andrew Sanderford find rental premiums of 10.2% and 14.7%, respectively for those properties with LEED certification. The addition of the continuous Walk Score, to control for variations in urban form, results in premiums of 7.4% and 9.6%, respectively. These findings are directionally consistent with those found in earlier studies, and demonstrate a persistence in rental premiums for certified properties over time, and with increased LEED adoption.
https://tinyurl.com/2o4r3tp2

by Jeremy Gabe,Karen McGrath,Spenser Robinson &Andrew Sanderford
Article: 2162515; Published online: 17 Jan 2023

The External Costs of Industrial Chemical Accidents: A Nationwide Property Value Study

Abstract:
Industrial chemical accidents involving fires, explosions, or toxic vapors impose external costs on nearby communities. We examine changes in residential property values using nationwide data on chemical facilities, accidents, and residential transactions within a spatial difference-in-differences framework. Dennis Guignet, Robin R. Jenkins, Christoph Nolte, and James Belke find that accidents with direct offsite impacts lower home values within 5.75 km by 2-3%, an effect that remains for at least 15 years. We estimate an average loss of $5,350 per home, which translates to a $39.5 billion loss to communities around the 661 facilities where an offsite impact accident occurred. They assess the assumptions needed for a formal welfare interpretation and conclude these results roughly approximate losses experienced by nearby residents.

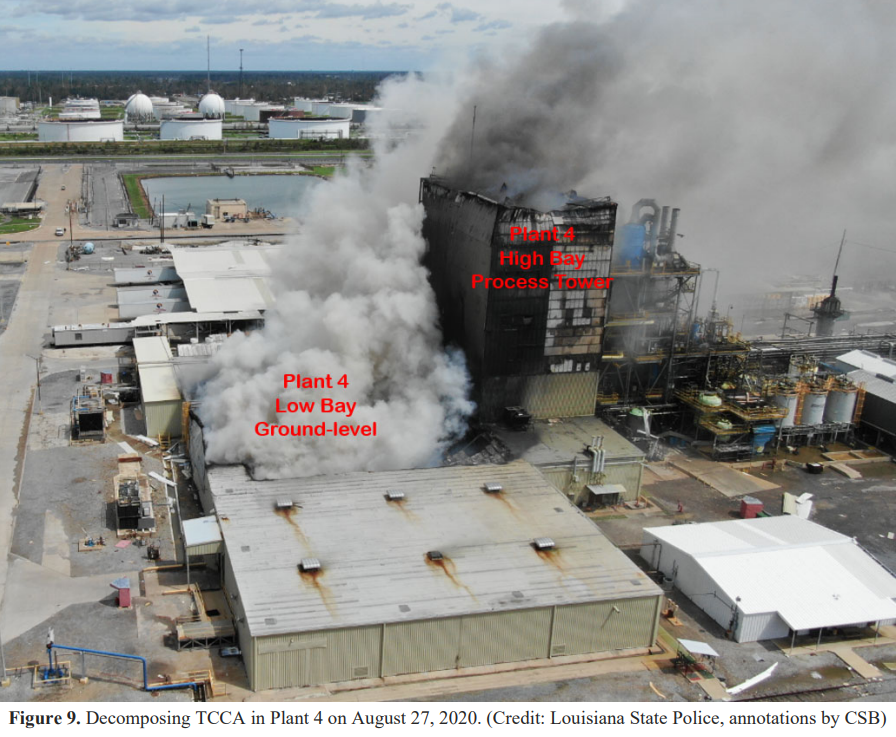
Trichloroisocyanuric Acid Reaction, Decomposition and Toxic Gas Release at Bio-Lab, Inc.
Westlake, LA | August 27, 2020

by Dennis Guignet, Robin R. Jenkins, Christoph Nolte, and James Belke
U.S. Environmental Protection Agency (EPA) www.EPA.gov Environmental Economics Working Paper Series
Paper Number: 2023-01; Document Date: 02/2023
https://www.epa.gov/environmental-economics/external-costs-industrial-chemical-accidents-nationwide-property-value

Evaluating Property Value Impacts from Water-Related 'Green Infrastructure': A Hedonic Modeling Approach

Abstract:
Over the past several decades, the rapid growth of Southwestern United States desert cities is creating significant climate and water scarcity challenges. City planners are using green infrastructure to mitigate these challenges and develop more livable, sustainable, and resilient communities. This study uses hedonic pricing modeling (HPM) to evaluate how constructed wastewater wetlands impact home values integrated into the project design. It compares Crystal Gardens in Avondale, AZ, consisting of 14 engineered wastewater filtering ponds, to nearby neighborhoods with desert landscaping. HPM revealed higher values for Crystal Gardens homes overall (7%) and significant increases for homes on the ponds (14%). Results demonstrate the economic value of integrating water-related infrastructure in desert cities for home sales. For a more accurate benefit assessment, additional research is needed on how the ecosystem services provided by these constructed wetlands contribute to greater property values.


by Jonathan Davis; Bjoern Hagen; Yousuf Mahid; David Pijawka
Journal of Green Building via Allen Press https://meridian.allenpress.com/jgb
Winter, 2023;  Volume 18, Issue 1, pages 3–16.
https://doi.org/10.3992/jgb.18.1.3

Sunday, May 21, 2023

Who Benefits from Hazardous Waste Cleanups? Evidence from the Housing Market

Abstract
The Resource Conservation and Recovery Act (RCRA) manages cleanup of hazardous waste releases at over 3,500 sites across the US, which covers approximately 17.5% of all developed land in the country. This paper evaluates the national housing market impacts of cleanups performed under RCRA and estimates the program's impacts on neighborhood change. We find that cleanups near residential properties yield significant, yet localized, increases in home prices, and that impacts are concentrated in the lower deciles of the price distribution. Importantly, we find no evidence of sorting along socio-demographic dimensions in response to cleanup. Our findings suggest that cleanup benefits accrue to the residents who are the original “hosts” of pollution and could correct pre-existing disparities in exposure to land-based contamination.
...
This paper evaluates the housing market impacts of cleanups conducted under the Resource Conservation and Recovery Act (RCRA). We find that the positive environmental impacts from RCRA cleanups are reflected in the housing market, indicating that people are aware of cleanups and value the water quality improvements documented in Cassidy et al. (2020). The price increases that we find are driven by cleanups concentrated among the lowest price deciles of the census tract in which the RCRA facility is located: Prices increase by 11% for the 1st decile of the price distribution, and we detect no evidence of a price increase for the 9th decile. This indicates cleanups raise housing values of the poorest segments of the population, which are likely to face other disadvantageous circumstances in life and are typically more vulnerable to the deleterious effects of pollution (see, e.g. Apelberg, Buckley and White, 2005). 

Furthermore, we find that the benefits of cleanups accrued to those living closest to the sites and, notably, do not find that cleanups induced re-sorting. This is consistent with the localized price impacts that we find, but somewhat surprising given how expansive RCRA cleanups were and the recent literature that has highlighted the potential for policies to worsen underlying inequities (Hausman and Stolper, 2020; Bakkensen and Ma, 2020). Ultimately, whether environmental cleanups lead to neighborhood turnover is an empirical question that has far-reaching consequences for whether a policy would exacerbate pre-existing socio-economic disparities.

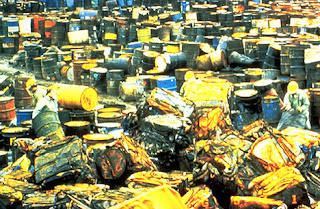
The Valley of the Drums, a toxic waste dump in northern Bullitt County, Kentucky
https://en.wikipedia.org/wiki/Hazardous_waste#/media/File:Valleyofdrums.jpg

by Alecia W. Cassidy, Elaine L. Hill & Lala Ma
National Bureau of Economic Research (NBER) www.NBER.org
Working Paper 30661; Issue Date November 2022

Thursday, May 11, 2023

Climate change and commercial real estate: Evidence from Hurricane Sandy

Abstract
[Jawad M. Addoum, Piet Eichholtz, Eva Steiner and Erkan Yönder] study how professional investors capitalize flood risk in commercial real estate (CRE) markets after hurricane Sandy. [The authors] show that New York CRE exposed to flood risk trades at a large, persistent discount. CRE in Boston, which mostly escaped direct hurricane-related damage, also exhibits persistent price penalties. These price effects are driven by asset-level capitalization rates, not building occupancy. Results from a placebo test using real estate prices in Chicago show that our inferences are not driven by coincidental, unrelated price trends for waterfront real estate assets. [Their] results are consistent with professional investors responding to a persistent shift in the salience of flood risk post-Sandy, even in locations spared by the disaster.

Table 2 presents the output from Equation (4). Column (1) shows the price impact regression results for New York. The estimates suggest that, all else equal, a one-mile increase in coastal proximity is associated with 21.6% slower price appreciation. The authors present the results for Boston in column (2). The estimates suggest that a one-mile increase in coastal proximity is associated with 9.5% slower price appreciation. The economic magnitude of this effect is equivalent to about 40% of the effect [they] estimate in New York. Given the absence of physical damages in Boston, [Addoum, Eichholtz, Steiner and Yönder] attribute this portion of the effect to increased salience and perception of flood risk, and the remaining 60% of the New York effect to the economic fallout from physical damages sustained during Sandy.

https://doi.org/10.1111/1540-6229.12435
by Jawad M. Addoum, Piet Eichholtz, Eva Steiner, Erkan Yönder
Real Estate Economics via Wiley
First published: 23 March 2023 
Open Access

Wednesday, May 10, 2023

The Value of Scattered Greenery in Urban Areas: A Hedonic Analysis in Japan

Abstract
This study investigates the impact of scattered greenery (street trees and yard bushes), rather than cohesive greenery (parks and forests), on housing prices. The authors identify urban green space from high-resolution satellite images and combine these data with data on both condominium sales and rentals to estimate hedonic pricing models. They find that scattered urban greenery within 100 meters significantly increases housing prices, while more distant scattered greenery does not. Scattered greenery is highly valued near highways, and the prices of inexpensive and small for-sale and for-rent properties are less affected by scattered greenery. These results indicate that there is significant heterogeneity in urban greenery preferences by property characteristics and location. This heterogeneity in preferences for greenery could lead to environmental gentrification since the number of more expensive properties increases in areas with more green amenities.
...
Their results show that a 10% increase in scattered greenery within 100 m increases the price of apartments for sale by approximately 2 to 2.5% (from 740,000 to 930,000 JPY) when evaluated at average housing prices. 

Sander et al. (2010), who analyzed green space in Minnesota, reported that a 10% increase in the tree canopy within 100 m increased the average housing price by 0.48% and that the average tree canopy within 250 m increased the average price by 0.29%. Their estimated impact, which is larger than those in previous works, could be caused by the characteristics of the study area. Their study area has little green space, so the value of greenery could be high (Brander and Koetse 2011; Siriwardena et al. 2016). Additionally, trees and grasses that reduce noise and pollution might be highly valued due to the high population density and traffic in their study area (Perino et al. 2014; Votsis 2017). The authos provide a subsample analysis in the following sections and address the mechanisms underlying the results of these green assessments.

by Yuta Kuroda & Takeru Sugasawa
Environmental and Resource Economics  via Springerlink www.SpringerLink.com
Volume 85, Pages523–586 (2023)

Saturday, January 22, 2022

Valuing the Impact of Air Pollution in Urban Residence Using Hedonic Pricing and Geospatial Analysis, Evidence From Quito, Ecuador

Abstract
This study attempts to determine the marginal willingness to pay for cleaner air in the Metropolitan District of Quito (DMQ) Equador by estimating the impact of air pollutants on property values. Spatial interpolation techniques portray pollutant concentrations in the DMQ.  A hedonic model estimates air pollution impacts on properties.  Impacts of three pollutants, (Particulate Matter-PM2.5, Nitrogen Dioxide-NO2, and Sulfur Dioxide-SO2) were estimated. The impact were statistically significant with decreases in property values of between 1.1% and 2.8%, or between $1,846.20 and $4,984.74 US$.
...
The most significant impact was from NO2 with a coefficient of ‒2.765, meaning that an increase in 1% of this pollutant will have a 2.8% decrease in the property price.  NOx is one of the very few air pollutants that people are able to perceive. This result is significant since the average residence value is 865.13 US$/m2, meaning a reduction in house value of 23.92 US$/m2. The other one is O3, which was also statistically significant, but only at 10%. The impact of a 1% increase in concentration of O3 will decrease the residence value 7.41 US$/m2. The other two air pollutants are odorless. PM2.5, had a coefficient of ‒1.733 and was statistically significant at the 95%  level. implying that an increase of 1% in PM2,5 concentrations will reduce a property's value 14.99 US$/m2. CO had a coefficient of ‒1,103 and was significant at 99%, meaning that an increase in CO concentration will reduce home value by 9.54 US$/m2
https://doi.org/10.1177/11786221211053277
by Sebastian Borja-Urbano, Fabián Rodríguez-Espinosa, Marco Luna-Ludeña
Universidad de las Fuerzas Armadas – ESPE, Sangolquí, Ecuador
Corresponding Author: Fabián Rodríguez-Espinosa, Departamento de Ciencias de la Tierra y Construcción, Universidad de las Fuerzas Armadas ESPE, Av. Gral. Rumiñahui s/n, Sangolquí, Ecuador. Email: ffrodriguez3@espe.edu.ec
Air, Soil and Water Research via Sage Publications
Volume 14; First Published November 22, 2021; Open Access

Wednesday, January 19, 2022

Comparing Pollution Where You Live and Play: A Hedonic Analysis of Enterococcus in the Long Island Sound

Abstract:
Hedonic property value studies of water quality conventionally focus on water quality levels measured nearest a home. This study examines whether water quality at the nearest access point (i.e., a beach) matters more to local residents.  Megan Kung, Dennis Guignet and Patrick Walsh conduct a hedonic analysis of water quality in the Long Island Sound, where an aging infrastructure and heavy precipitation lead to frequent sewage overflows. The analysis focuses on bacteria contamination and beach closures at various access points and monitoring sites. Results suggest that decreases in water quality measured at the nearest beach yield a larger negative effect and impact homes at a farther spatial extent than previously suggested in the literature.
...
Model 1 has two variants (SAC and FE) which follow the conventional approach in the literature and link homes to the water quality measures at the closest monitoring site.  The SAC is a general spatial model, which includes a spatiotemporal lag of neighboring house prices as a means to account for spatially correlated omitted variables and FE is a municipality-by-year fixed-effects model.  The SAC 1 results suggest homes within 500 meters (m.) of the Sound are affected the most, experiencing an average decrease in price of 0.16% for a 10% increase in enterococci. For the homes in this distance bin, which have an average price of $1,001,651, this translates to an average decrease in home value of $1,583. A similar elasticity is estimated for the 500–1,000 m bin. Any negative elasticity estimates beyond 1,000 m are statistically insignificant. The estimated price effects are small relative to the overall price of a home, but are in line with previous estimates.  The corresponding FE 1 model suggests a negative, but small and statistically insignificant, elasticity in the nearest-distance bin. The –0.0127 elasticity in the 500–1,000 m bin is similar to that of the SAC 1 model, but the two models differ in that the FE 1 model suggests possible negative elasticities as far as 2,000 m.
Cladophora, a wiry green seaweed, is found in great abundance in Little Narragansett Bay, fertilized by a high load of nitrogen entering the bay. Dense mats of the seaweed are oxygen factories during the day, but use up all of the oxygen during the night, leaving none for the animals. Only animals tolerant of very low oxygen, ones who can essentially hold their breath through the night, are found in areas where this seaweed is thick. In mid-summer, the seaweed is so abundant and productive, excess oxygen bubbles out of the water and can cause large mats of the seaweed to float to the surface. Credit: Jamie Vaudrey, UConn https://phys.org/news/2017-02-unveils-tool-cleaner-island.html

In SAC and FE Models 2 and 3, the authors deviate from the conventional approach of matching to the nearest monitoring site, and instead explicitly account for water quality at the nearest beach. In doing so, they see that any previously negative coefficients corresponding to water quality at the portion of the waterbody nearest the home are now statistically insignificant.

In Model 2 when they consider water quality at the closest beach (conditional on water quality measured nearest the home), there is a strong negative effect that is larger in magnitude and spatial extent. SAC 2 shows that among homes nearest a beach (0–500 m bin), a 10% increase in enterococci decreases house prices by 0.31%. These homes have an average price of $1,259,349, and so this translates to an average implicit price of $3,904. This result is virtually identical in the FE variant of Model 2.  Results suggest that the negative elasticity associated with water quality at the nearest beach could extend to 3,500 m. For homes in the farthest significant distance bin in SAC 2 (3,000–3,500 m, which have an average price of $844,851), the mean implicit price for a 10% increase in enterococci levels at the nearest beach is a decrease of $1,369.  The FE 2 model suggests that this effect is even larger; the estimated –0.0531 elasticity for the 3,000–3,500 m bin suggests an average implicit price of $4,486. The statistically significant effects of beach enterococci levels are not consistently found in all distance bins out to 3,500 m.
...
In a meta-analysis of hedonic property value studies examining water quality, Guignet et al. (2020) report a mean elasticity with respect to fecal coliform counts of –0.018 and –0.020 for waterfront and non-waterfront homes within 500 m, respectively. These are quite similar to our estimated elasticities with respect to enterococci counts.
...
In the SAC 3 and FE 3 models, they account for the number of beach closure days in summer. The results suggest that home buyers and sellers do, on average, respond more to beach closures than to enterococci levels. The estimated price effects of beach closures are of the expected negative sign, with robust and statistically significant negative effects in all distance bins out to 2,000 m from the beach. With the exception of the 2,000–2,500 m bin, we find significant negative effects extending out to 3,500 and even 4,500min models SAC 3 and FE 3, respectively. In general, the estimated beach closures effect in the SAC and FE models are very similar. These more robust, farther extending, and statistically significant estimates seem reasonable given that beach closures and notifications are a more direct and salient signal to local residents regarding water quality. When comparing estimates across the variants of Models 2 and 3 in table 3, we see that accounting explicitly for beach closures decreases the magnitude and/or significance of the estimated beach enterococci elasticities, especially in the nearest-distance bins.
...
For one additional beach day closed each summer season, the estimates translate to an average decrease in home value of $2,123 for homes in the 0–500 m bin, and $598 for homes in the 3,000–3,500 m bin. These estimates suggest that if the nearest beach is closed an additional week every year, there would be an average price decrease of $14,859 for homes in the 0–500 m bin, and $4,188 for homes in the 3,000–3,500 m bin. This is a plausible magnitud  given that the average number of beach days closed per season is seven, and there have been instances where beaches were closed for most of, or even the entire, season.
...
With these caveats in mind, local stakeholders can still make better-informed decisions by comparing the potential house price effects estimated in this study with the costs of policies and projects to improve water quality in the Long Island Sound.... Consider a hypothetical program in New Rochelle, a city in Westchester County, that reduces the number of beach closures each summer season from the average of seven days a year to zero. Our results from SAC 3, for example, suggest that this would yield a total increase in value of the 5,672 single-family homes and townhomes within 3.5 km of a beach in New Rochelle by about $50.2 million. Note that we omitted homes in the statistically insignificant 2,000–2,500m. bin for this calculation. As a rough comparison, a project to repair the sewer infrastructure and prevent stormwater infiltration and subsequent sewage overflows in New Rochelle cost about $20 million (Garcia 2015b), which is substantially less than the estimated capitalization effects in this purely illustrative example. These capitalization effects reflect only a portion of the benefits to local stakeholders because households farther away who use these beaches will also benefit.

https://www.journals.uchicago.edu/doi/suppl/10.1086/717265
by Megan Kung 1, Dennis Guignet 2, and Patrick Walsh 3
1. Economist, Los Angeles Regional Water Quality Control Board, 320 W. 4th Street #200, Los Angeles, CA 90013 USA (email: megan.kung@waterboards.ca.gov). 
2. Assistant Professor, Department of Economics, Appalachian State University, 416 Howard Street, Room 3101B, Peacock Hall, ASU Box 32051, Boone, NC 28608 USA (email: guignetdb@appstate.edu).
3. Economist, National Center for Environmental Economics, US Environmental Protection Agency, 1200 Pennsylvania Avenue, NW, Washington, DC 20460 USA (email: walsh.patrick.j@epa.gov).
Published online December 3, 2021.
Marine Resource Economics via The University of Chicago Press on behalf of the MRE Foundation Volume 37, Number 1, January 2022.

Monday, January 17, 2022

Systematic Variation in Waste Site Effects on Residential Property Values: A Meta-Regression Analysis and Benefit Transfer

Abstract:
This article presents a meta-analysis based on 727 estimates from 83 hedonic pricing studies to provide new insights on the effects of waste sites on residential property values. Relative to previous meta-analyses on this subject, estimates are corrected for publication bias and the ability of the meta-regression model to produce reliable benefit-transfer estimates is assessed. Proximity to severely contaminated waste sites has a supremely negative impact on residential property values, whereas on average the distance from non-hazardous waste sites has no effect. Correcting for publication bias has a sizeable impact, reducing the average effect size by up to 38%. Benefit-transfer errors based on the meta-regression model are fairly large and, in line with the broader literature, outperform simple value transfer when the underlying data sample is heterogeneous. 
...
The corrected average effect size translates into a 1.5% to 2.9% property value increase per mile of increased distance from a waste site for a house at a one-mile distance. These estimates are situated in the lower range of values produced by the previous literature. The results are generally robust across justifiable estimators, weighting schemes and the replacement of moderators.
...
The subsample analyses revealed distinct differences for severely contaminated sites on the NPL and non-hazardous waste sites. As non-hazardous waste sites do not reduce property values on average, they are not considered a disamenity in these average cases. By contrast, severely contaminated waste sites on the NPL clearly reduce residential property values on average, with an estimated mean effect size of 42.2%. 
...

by Marvin Schütt; Institute for Environmental, Resource and Spatial Economics, Kiel University, Wilhelm-Selig-Platz 1, 24118, Kiel, Germany
Environmental and Resource Economics via Springer
Volume 78, 2021; Pages 381–416; Published: 24 February 2021

Wednesday, October 28, 2020

Neglected No More: Housing Markets, Mortgage Lending, and Sea Level Rise

In this paper, we explore dynamic changes in the capitalization of sea-level rise (SLR) risk in housing and mortgage markets. Our results suggest a disconnect in coastal Florida real estate: From 2013-2018, home sales volumes in the most-SLR-exposed communities declined 16-20% relative to less-SLR-exposed areas, even as their sale prices grew in lockstep. Between 2018-2020, however, relative prices in these at-risk markets finally declined by roughly 5% from their peak. Lender behavior cannot reconcile these patterns, as we show that both all-cash and mortgage-financed purchases have similarly contracted, with little evidence of increases in loan denial or securitization. We propose a demand-side explanation for our findings where prospective buyers have become more pessimistic about climate change risk than prospective sellers. The lead-lag relationship between transaction volumes and prices in SLR-exposed markets is consistent with dynamics at the peak of prior real estate bubbles. 
Miami during a king tide (October 17, 2016) https://en.wikipedia.org/wiki/Sea_level_rise

by Benjamin J. Keys & Philip Mulder
National Bureau of Economic Research (NBER) www.NBER.org
Issue Date October 2020

https://en.wikipedia.org/wiki/Sea_level_rise

Friday, January 10, 2020

On the use of Hedonic Regression Models to Measure the Effect of Energy Efficiency on Residential Property Transaction Prices: Evidence for Portugal and Selected Data Issues

Abstract
Using a unique dataset containing information of around 256 thousand residential property sales, this paper discloses a clear sales premium for most energy-efficient dwellings, which is more pronounced for apartments (13%) than for houses (5 to 6%). Cross-country comparisons support the finding that energy efficiency price premiums are higher in the Portuguese residential market than in central and northern European markets. Results emphasize the relevance of data issues in hedonic regression models. They illustrate how the use of appraisal prices, explanatory variables with measurement errors, and the omission of variables associated with the quality of the properties, may seriously bias energy efficiency partial effect estimates. These findings provide valuable information not only to policymakers, but also to researchers interested in this area.
https://inhabitat.com/energy-efficient-villa-in-portugal-uses-locally-sourced-cork-for-insulation/
https://rem.rc.iseg.ulisboa.pt/wps/pdf/REM_WP_064_2019.pdf
by Rui Evangelista 1, Esmeralda A. Ramalho ad Joao Anrade E. Silva 3
1. Instituto Nacional de Estatística, rui.evangelista@ine.pt
2. Universidade de Lisboa, Instituto Superior de Economia e Gestão & REM - CEMAPRE,
eramalho@iseg.ulisboa.pt
3. Universidade de Lisboa, Instituto Superior de Economia e Gestão & REM - CEMAPRE,
joaoas@iseg.ulisboa.pt
REM – Research in Economics and Mathematics
REM Working Paper 064-2019; Lisbon, Portugal; January 2019

Value of playgrounds relative to green spaces: Matching evidence from property prices in Australia

Abstract
We examine the effect on house prices of the presence of a small playground relative to an empty green space using a matching approach combined with hedonic regression analysis. Using a data set of 33,521 property sales in urban Australia, we match properties near small playgrounds to similar properties near two empty, open green spaces which are candidates for playground construction. We control for property characteristics and distance to a wide range of urban amenities and other open spaces. We find that the presence of a playground within 300 metres adds about AU$20,000 (4.6 per cent) to the average property price. The price effect of a playground is larger for houses than apartments and falls with distance from the playground.
A Melbourne Natural Playground Named Australia’s Best Playground
https://www.childrenandnature.org/2016/06/03/a-melbourne-natural-playground-named-australias-best-playground/
Highlights
• We assess the impact on property prices of the presence of a small playground.
• We combine hedonic regression with a matching approach.
• A small playground adds five per cent to the price of properties within 300 meters
• Playgrounds add more to house prices than non-house property prices.
• The price impact of playgrounds falls as distance to the playground increases.

by Robert Breunig 1 Syed Hasan 2 KymWhiteoak 3
1. Crawford School of Public Policy, Australian National University, Canberra, ACT 0200, Australia
2. School of Economics and Finance, Massey University, Palmerston North, New Zealand
3. RM Consulting Group Suite 1, 357 Camberwell Road, Camberwell, VIC 3124, Australia
Landscape and Urban Planning via Elsevier Science Direct www.ScienceDirect.com
Volume 190; October, 2019; 103608

Urban trees, house price, and redevelopment pressure in Tampa, Florida

Abstract
We examined the relationship between urban trees and the sales price of single-family homes in Tampa, Florida. We chose Tampa, because the city is facing major redevelopment pressure that may impact the association between trees and house price. In particular, a frequently voiced view in Tampa’s development community is that trees adversely affect the value of houses that are being sold for redevelopment. We estimated hedonic models of sales price controlling for house and neighborhood characteristics and correcting for spatial autocorrelation (n = 1,924). We found that trees within 152m (500 feet) of a house’s lot were significantly associated with higher sales prices. Specifically, a 1-percentage point increase in tree-canopy cover was associated with a total increase in sales price of $9,271 to $9,836 (results were largely insensitive to correction for spatial autocorrelation). Our results demonstrate that, even in a city facing major redevelopment pressure, trees are associated with higher sales prices.

Highlights
• Trees on or right next to a house’s lot are not associated with higher sales price.
• In contrast, houses with more neighborhood trees sell for a price premium.
• Despite redevelopment pressure, trees are a neighborhood amenity.

 
https://www.tampagov.net/sites/default/files/parks-and-recreation/files/purple_tab_bg.pdf
by Geoffrey H. Donovan 1, Shawn Landry 2 and Cody Winter 3
1. USDA Forest Service, PNW Research Station, 620 SW Main, Suite 502, Portland, OR, 97205, USA
2. University of South Florida, School of Geosciences, 4202 E Fowler Ave., NES107, Tampa, FL, 33620, USA
3. Environmental Protection Commission, 3629 Queen Palm Drive, Tampa, FL, 33619, USA
Urban Forestry & Urban Greening via Elsevier Science Direct www.ScienceDirect.com
Volume 38; February, 2019; Pages 330-336

Tuesday, January 7, 2020

Lead Pipes, Prescriptive Policy and Property Values

Abstract:
Several recent incidences of severe waterborne lead exposure have public authorities and communities across the US rethinking their strategies to address aging water infrastructure. One common question: who should pay for updates? This paper provides evidence of positive property value capitalization effects following remediation of private lead service lines in Madison, WI. Using a 16-year panel of property transactions data and a universal and prescriptive policy change, I identify an average post-replacement price effect on the order of 3–4% of a property’s value. This implies a more than 75% average return on public and private remediation costs, suggesting homeowners strongly value the benefits of lead reduction in publicly supplied drinking water.
Image result for lead in water
https://news.fordham.edu/science/lead-water-and-6-things-you-can-do/
by Adam Theising, Department of Agricultural and Applied Economics, University of Wisconsin-MadisonMadisonUSA
Environmental and Resource Economics via Springer Link www.SpringerLink.com
November, 2019; Volume 74, Issue 3, pages 1355–1382|

Friday, April 28, 2017

The Effect of the Nengda Incineration Plant on Residential Property Values in Hangzhou, China

Abstract:
Incineration plants and derelict industrial sites can have a number of adverse effects on the local environment and social welfare, including diminution of property values. Although many incineration plants exist in China, there has been relatively little research done to estimate the negative externality affects there. In this paper, we examine the effects of the Nengda municipal incineration plant in Hangzhou city on residential property values. We employ a hedonic pricing model to examine the sales of over 500 residential condominium units in over 20 multifamily buildings within ten kilometers of the incineration plants over a one-year-period including 2014. The results show that proximate properties show decreases in initial listing price of up to 25.9%, declining monotonically until the effect is gone at three kilometers from the incinerator. These results are comparable to similar situations in the United States and Canada.
by Qinna Zhao 1, Robert A. Simons 2, Fan Li-jun 1, Zhong Fen 1
1. Hefei University of Technology, Hefei, Anhui, China 230009 
2. Cleveland State University, Cleveland State University, Cleveland, OH 44115 or r.simons@csuohio.edu.
Journal of Real Estate Literature
Volume 24, Number 1; 2016; pages 85-102

Tuesday, March 7, 2017

Nuclear power plant closures and local housing values: Evidence from Fukushima and the German housing market

Abstract:
The Fukushima Daiichi accident in Japan in March 2011 caused a fundamental change in Germany’s energy policy which led to the immediate shut down of nearly half of its nuclear power plants. Using data from Germany’s largest internet platform for real estate and employing a difference-in-differences approach, we find that Fukushima reduced housing prices near nuclear power plants that were in operation before Fukushima by 4.9%. Housing prices near sites that were shut down right after the accident even fell by 9.8%. Our results suggest that on the German housing market, the negative economic effects of the closure of nuclear power plants dominate potential positive changes in local amenities.
by Thomas K. Bauer 1 and 2, Sebastian T. Braun, 3 c, and 4, Michael Kvasnickae,  5 and 6, 
1. RWI-Leibniz-Institut für Wirtschaftsforschung, Hohenzollernstr. 1-3, 45128 Essen, Germany
2. Ruhr-University Bochum, RWI-Leibniz-Institut für Wirtschaftsforschung, IZA, Germany
3. University of St Andrews, School of Economics and Finance, Castlecliffe, The Scores, KY16 9AR, UK
4. University of St Andrews, UK, Kiel Institute for the World Economy, Germany
5. Otto von Guericke University Magdeburg, Universitätsplatz 2, 39016 Magdeburg, Germany
6. Otto von Guericke University Magdeburg, RWI-Leibniz-Institut für Wirtschaftsforschung, IZA, Germany
Journal of Urban Economics via Elsevier Science Direct www.ScienceDirect.com
Volume 99; May, 2017; Pages 94–106; Available online 10 February 2017
Keywords: Fukushima; Nuclear power plants; Housing prices; Germany

Monday, March 6, 2017

Estimating the Residential Land Damage of the Fukushima Nuclear Accident

Abstract:
The cost of a nuclear power plant accident critically depends on people’s willingness to pay for avoiding exposure to the nuclear fallout. This paper is the first to estimate such a willingness to pay by observing the change in transaction prices before and after the Fukushima nuclear accident with the degree of radioactive contamination. The estimates, which are based on hedonic price equations with the degree of radioactive contamination measured by airborne surveys, indicate that the contamination decreased the price of residential land and imply a substantial willingness to pay to avoid exposure to the radioactive fallout. The estimated total residential land depreciation ranges from 1.5 to 3.0 trillion yen, approximately equivalent to 15-30 billion US dollars, or about 0.13-0.25% of Japan’s total land value.
by Daiji Kawaguchi, 1 and Norifumi Yukutake 2 
1. Graduate School of Economics, The University of Tokyo, Hongo 7-3-1, Bunkyo-ku, Tokyo 113-0033, Japan
2. College of Economics, Nihon University, Misaki-cho 1-3-2, Chiyoda-ku, Tokyo 102-8360, Japan
Journal of Urban Economics via Elsevier Science Direct www.ScienceDirect.com
Available online 2 March 2017; In Press, Accepted Manuscript
Keywords: Willingness to Pay; Fukushima; Nuclear Power Plant; Land Property Damage; Radioactive Contamination; Land Contamination

Tuesday, February 28, 2017

Consequences of the Clean Water Act and the Demand for Water Quality

Abstract:
Since the 1972 U.S. Clean Water Act, government and industry have invested over $1 trillion to abate water pollution, or $100 per person-year. Over half of U.S. stream and river miles, however, still violate pollution standards. We use the most comprehensive set of files ever compiled on water pollution and its determinants, including 50 million pollution readings from 170,000 monitoring sites, to study water pollution's trends, causes, and welfare consequences. We have three main findings. First, water pollution concentrations have fallen substantially since 1972, though were declining at faster rates before then. Second, the Clean Water Act's grants to municipal wastewater treatment plants caused some of these declines. Third, the grants' estimated effects on housing values are generally smaller than the grants' costs....
The share of waters that are not fishable fell on average by about half a percentage point per year, and the share that are not swimmable fell at the same rate. In total over the period 1972-2001, the share of waters that are not fishable and the share not swimmable each fell by 11 percentage points. Each of the four pollutants which are part of these fishable and swimmable definitions declined rapidly during this period. Fecal coliforms had the fastest rate of decrease, at 2.8 percent per year. BOD, dissolved oxygen deficits, and total suspended solids all declined more slowly, at about 1.5 percent per year.

Trends in all these pollutants since the Clean Water Act are large, but trends before the Clean Water Act were larger. For example, BOD was falling by 3 percent per year before the Clean Water Act and 1.5 percent after it. We find pre/post 1972 trend breaks of comparable magnitudes for all the other pollutants. We interpret these pre-1972 trends somewhat cautiously since, as discussed earlier, relatively few monitoring sites recorded data before the 1970s, and fewer long-term monitoring sites operated in the 1960s.
...
We find that [Clean Water Act] grants cause large and statistically significant decreases in pollution. Each grant decreases dissolved oxygen deficits by 0.8 percentage points, and decreases the probability that downstream waters are not fishable by 0.7 percentage points. The other pollutants decrease as well | BOD falls by about 3.4 percent, fecal coliforms fall by 8.5 percent, and the probability that downstream waters are not swimmable by about half a percentage point. The point estimate implies that each grant decreases TSS by one percent, though is imprecise. TSS comes primarily from non-point sources like agriculture and urban runoff, so is less closely related to municipal wastewater.

Event study graphs support these results. These graphs are estimated from specifications corresponding to equation.  In years before a grant, the coefficients are all statistically indistinguishable from zero, have modest magnitude, and have no clear trend.... This implies that pollution levels in upstream and downstream waters had similar trends before grants were received. In the years after a grant, downstream waters have 1-2 percent lower dissolved oxygen deficits, and become 1-2 percent less likely to violate fishing standards. These effects grow in magnitude over the first ten years, are statistically significant in this period, and remain negative for about 30 years after a grant.
...
The cost to increase dissolved oxygen saturation in a river-mile by 10 percentage points.... .The simplest specification ... implies that it cost $0.57 million per year to increase dissolved oxygen saturation in a river-mile by ten percent; the broadest specification ... implies that it cost $0.54 million per year. The annual cost to make a river-mile fishable ranges from $1.8 million in the simplest specification ... to $1.5 million in the richest specification....  The grants program made 16,000 river-miles fishable.
...
The estimates ... are generally consistent with near complete pass-through, i.e., little or no crowding out or in beyond the required municipal capital copayment. The Panel A pass-through estimates range from 1.15 to 1.27 in real terms or 1.53 in nominal, which mean that city expenditure increased by around the amount of the typical copay (which was typically a third of the federal grant). Panel B ... includes the local copayment in the main explanatory variable,... and the estimates imply pass-through rates of 0.86 to 0.94 in real terms or 1.09 in nominal terms.  
,,,
Table 5 analyzes how Clean Water Act grants affect housing. Column (1) shows estimates for homes within a quarter mile of downstream waters. Column (2) adds controls for dwelling characteristics, and for baseline covariates interacted with year fixed effects. Column (3) include all homes within 1 mile, and column (4) includes homes within 25 miles.
Panel A reports estimates of how grants affect log mean home values. The positive coefficients in the richer specifications of columns (2) through (4) are consistent with increases in home values, though most are statistically insignificant. Column (4) implies that each grant increases mean home values within 25 miles of affected waters by three hundredths of a percentage point. The 0.25 or 1.0 mile estimates are slightly larger than the 25 mile estimate, which is consistent with the idea that residents nearer to the river benefit more from water quality. Panel B analyzes how grants affect log mean rental values. These estimates are generally smaller than the estimates for housing. The estimate in column (4), including homes within a 25 mile radius of downstream rivers, is small but actually negative.

Panels A and B reflect the classic hedonic model, with fixed housing stock. Panels C and D estimate the effect of grants on log housing units (panel C) or the log of the total value of the housing stock (panel D). In the presence of elastic housing, measuring only price effects (as in Panels A and B) could understate willingness-to-pay for local amenities. Moreover, many cities have had substantial waterfront development, which could be related to water quality.

Panels C and D suggest similar conclusions as Panels A and B. Most of these estimates are small and actually negative. One is marginally significant (Panel C, column 1), though the precision and point estimate diminish with the controls of column (2). Column (4) in of Panel D literally implies that each grant decreases the total value of the housing stock within a 25 mile radius of downstream waters by one point five hundredths of a percentage point.


Figure 4 shows event study graphs, which suggest similar conclusions as these regressions. Panel A shows modest evidence that in the years after a plant receives a grant, the values of homes within 0.25 miles of the downstream river increase. The increases are statistically insignificant in most years and small in magnitude. Panel B shows no evidence that homes within 25 miles of the downstream river increase after a treatment plant receives a grant.
We also report a range of sensitivity analyses, which are broadly in line with the main results.
...
Considering all owner-occupied homes within 25 miles of the river, the estimated ratio of the grants aggregate effects on home values to the grants’ costs is 0.25. Adding rental units in column (3) does not change this estimate out to two decimal points.
...
Under [the] ... three approaches, the ratios of measured benefits to costs are -0.11 (0.16), 0.11 (0.31), and 0.11 (0.10), respectively.
...
Row 8 finds that grants to declining urban areas have slightly lower ratios, while the ratio for high amenity areas is greater. Finally, row 9 tests for differences in the housing market response by census region. This specification finds that grants to the Northeast have smaller ratios, while grants to the south have larger ratios around 0.73. None of these ratios in rows 6-9 are significantly different than that of the mean grant.

The map in Appendix Figure 10 shows heterogeneity in the ratio of measured benefits to costs across U.S. counties. This map assumes the same hedonic price function nationally and reflects spatial heterogeneity in the density of housing units. Specifically, these estimates divide treatment plants into ten deciles of the number of people in 2000 living within 25 miles of downstream river segments. They then use the regression estimates from column 4 of Table 5 to calculate the ratio of the change in the value of housing and grant costs, separately for each decile.
39 Finally, we average this ratio across all plants in each county.

The map shows that the ratio of measured benefits to costs is much larger in more populated counties. The bottom decile of counties, for example, includes ratios of measured benefits to costs of below 0.01. The top decile of counties includes ratios between 0.31 and 0.45. Grants and population are both highly skewed|37 percent of grant costs and 54 percent of population are in the top decile.

We take three overall conclusions from this analysis of heterogeneity. First, we find suggestive evidence that ratios of measured benefits to costs follow sensible patterns, though not all estimates are precise Second, none of these subsets of grants considered has a ratio of measured benefits to costs above one, though many of the confidence regions cannot reject a ratio of one. The largest ratios of estimated benefits to costs are for areas where outdoor fishing or swimming is common (ratio of 0.57), for high amenity urban areas (ratio of 0.63), and in the South (ratio of 0.74).