Showing posts with label Climate. Show all posts

Sunday, January 25, 2026

Does Urban Overheating Affect Neighborhood Attractiveness? Evidence from the French Housing Market

This article investigates urban overheating as an environmental "dis-amenity" that negatively impacts the health and quality of life for residents. By reducing the attractiveness of certain neighborhoods, overheating is hypothesized to exert downward pressure on housing prices. The study utilizes a unique "Thermocity" dataset, which provides high-resolution nighttime land surface temperature data from satellite observations across four French urban units. The methodology combines this climatic data with an exhaustive record of housing transactions from 2013 to 2019. To ensure accuracy, the author employs an "instrumental variable approach" using wind speed to address potential endogeneity in local temperature readings.

The analysis reveals a statistically significant negative relationship between local temperature increases and property values. This effect is not uniform across all studied areas, showing substantial variation between different urban units. The findings are robust even when using alternative measures of overheating from different data sources. As urbanization continues to increase and global temperatures rise, the incidence of urban overheating is expected to become a more prominent factor in the housing market. The research suggests that nearly 81.5% of the French population is now living in urban areas, making this a critical issue for public policy and urban planning.

The most striking finding is that a 1 °C increase in urban overheating is associated with a 2.2% decrease in housing prices. The study analyzed a total of four French urban areas using satellite data. The housing transaction dataset spanned a seven-year period from 2013 to 2019. Furthermore, the study notes that 81.5% of the French population currently resides in urban areas where these overheating effects are most pronounced. These results provide clear evidence of the economic "penalty" associated with living in heat-stressed urban environments.


Vincent, Pierre. "Does Urban Overheating Affect Neighborhood Attractiveness? Evidence from the French Housing Market." *Journal of Housing Economics* 71 (2026): 102111.  https://www.sciencedirect.com/science/article/pii/S1051137725000701

Wednesday, October 28, 2020

Temperature and economic activity: evidence from India

This paper investigates the impact of temperature on economic activity in India, using state-level data from 1980–2015. We estimate that a 1∘C increase in contemporaneous temperature (relative to our sample mean) reduces the economic growth rate that year by 2.5 percentage points. The adverse impact of higher temperatures is more severe in poorer states and in the primary sector. Our analysis of lagged temperatures suggests that our effects are driven by the contemporaneous effect of temperature on output; we do not find evidence of a permanent impact of contemporaneous temperatures on future growth rates.

by Anuska Jain,Roisin O'Sullivan &Vis Taraz
Journal of Environmental Economics and Policy https://www.tandfonline.com/toc/teep20/current  via Taylor Francis Online https://www.tandfonline.com/
Published online: 20 Feb 2020

Sunday, September 6, 2020

Valuing the Global Mortality Consequences of Climate Change Accounting for Adaptation Costs and Benefits

Abstract: 
This paper develops the first globally comprehensive and empirically grounded estimates of mortality risk due to future temperature increases caused by climate change. Using 40 countries' subnational data, we estimate age-specific mortality-temperature relationships that enable both extrapolation to countries without data and projection into future years while accounting for adaptation. We uncover a U-shaped relationship where extreme cold and hot temperatures increase mortality rates, especially for the elderly, that is flattened by both higher incomes and adaptation to local climate (e.g., robust heating systems in cold climates and cooling systems in hot climates). Further, we develop a revealed preference approach to recover unobserved adaptation costs. We combine these components with 33 high-resolution climate simulations that together capture scientific uncertainty about the degree of future temperature change. Under a high emissions scenario, we estimate the mean increase in mortality risk is valued at roughly 3.2% of global GDP in 2100, with today's cold locations benefiting and damages being especially large in today's poor and/or hot locations. Finally, we estimate that the release of an additional ton of CO2 today will cause mean [interquartile range] damages of $36.6 [-$7.8, $73.0] under a high emissions scenario and $17.1 [-$24.7, $53.6] under a moderate scenario, using a 2% discount rate that is justified by US Treasury rates over the last two decades. Globally, these empirically grounded estimates substantially exceed the previous literature's estimates that lacked similar empirical grounding, suggesting that revision of the estimated economic damage from climate change is warranted.


Time series of projected mortality risk of climate change. All lines show mortality effects of climate change across all age categories and are represented by a mean estimate across a set of Monte Carlo simulations accounting for both climate model and statistical uncertainty.

by Tamma A. Carleton, Amir Jina, Michael T. Delgado, Michael Greenstone, Trevor Houser, Solomon M. Hsiang, Andrew Hultgren, Robert E. Kopp, Kelly E. McCusker, Ishan B. Nath, James Rising, Ashwin Rode, Hee Kwon Seo, Arvid Viaene, Jiacan Yuan and Alice Tianbo Zhang
National Bureau of Economic Research www.NBER.org
NBER Working Paper No. 27599; Issued in July 2020

Wednesday, August 29, 2018

Hot Temperatures Decrease Worker Productivity, Economic Output - A new study finds hot weather may cause significant global economic losses because workers are less productive when it is warm. Air conditioning may not solve the problem.

From Montreal, Canada to Mount Washington, New Hampshire, heat records are being broken this summer in places not accustomed to sweltering temperatures. Studies have found that unusually hot weather is linked to lower economic output in countries around the world. Although several factors—from poor crop yields to heat-related illnesses—probably share part of the blame, there is also a more fundamental variable at play: When we get hot, we find it difficult to work. 

“Because human physiology is the same whether you live in India, the United States or anywhere else in the world, the connection between hot temperatures and lower productivity has fundamental implications for how we should think about the costs of climate change going forward,” says Anant Sudarshan, the South-Asia Director at the Energy Policy Institute at the University of Chicago.  

In a new study, Sudarshan and his coauthors analyzed the productivity of workers in India, the world’s third largest economy. They looked at both labor-intensive and highly automated manufacturing processes. In the first category, they found that the productivity of workers engaged in cloth weaving or garment manufacturing dropped by as much as 4 percent per degree as temperatures rose above 27° Celsius (80.6° Fahrenheit). However, when studying workers in the steel industry who were operating in plants with highly automated production they found that productivity did not fall when it got hot outside. 
Daytime view of a more-or-less cone-shaped peak, perhaps reaching two hundred feet above the surrounding terrain. It is sparsely covered in poor-looking shrubs and trees; it otherwise reveals only an aspect of heated naked rock. Assorted parti-coloured blocky concrete buildings reach down from its lower slopes to a temple tank in the near foreground, around which is arrayed the more rounded and ornate temple structures.
Alwar, on the fringes of the Thar Desert, registered a temperature of 50.6 °C (123.1 °F), India's highest, until it was broken in May 2016 at Phalodi at 51.0 °C (123.8 °F), another town in the desert state of Rajasthan. https://en.wikipedia.org/wiki/Climate_of_India
Heat did more than influence productivity at work. It also increased absenteeism. A one degree increase in the ten-day temperature average increased the probability that a worker would be absent by as much as 5 percent. Interestingly, this remained true even where the workplace used automation. Mechanization might reduce the effects of temperature on the shop floor, but may not solve the problem of employees missing work.

Less productive workers mean a less productive business, and a less productive economy. To determine if the declines in worker productivity decreased the output of factories, Sudarshan and his colleagues looked at data from almost 70,000 plants across India. They found that the value of output declined by about 3 percent for every degree above the average temperature. This loss is large enough to explain the entire reduction in India’s economic output in hot years

To adapt to hotter temperatures, businesses could install climate control measures such as air conditioning. Sudarshan and his coauthors collected data from a number of garment plants in the midst of a phased roll-out of shop floor cooling, providing the researchers with the opportunity to compare workers on the same day in nearby plants who did and did not have climate control. They found that workers in plants with climate control were more productive. But, the climate control measures didn’t remove absenteeism. 

Thursday, January 12, 2017

2016: A historic year for billion-dollar weather and climate disasters in U.S.

NOAA’s National Centers for Environmental Information (NCEI) tracks U.S. weather and climate events that have great economic and societal impacts (www.ncdc.noaa.gov/billions). Since 1980, the U.S. has sustained 203 weather and climate disasters where the overall damage costs reached or exceeded $1 billion (including adjustments based on the Consumer Price Index, as of January 2017). The cumulative costs for these 203 events exceed $1.1 trillion.

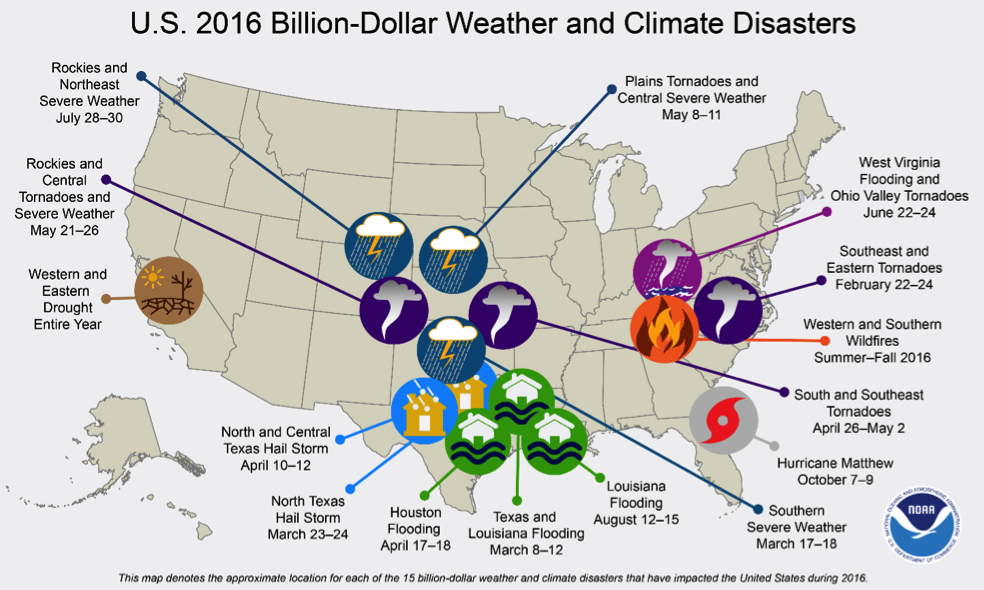
The year 2016 was an unusual year, as there were 15 weather and climate events with losses exceeding $1 billion each across the United States. These events included drought, wildfire, 4 inland flood events, 8 severe storm events, and a tropical cyclone event (see map below). Cumulatively, these 15 events led to 138 fatalities and caused $46.0 billion in total, direct costs. The 2016 total was the 2nd highest annual number of U.S. billion-dollar disasters, behind the 16 events that occurred in 2011.
Map of the US with icons showing location and type of 2016's billion-dollar disasters, including inland floods, hurricanes, fires, droughts, and tornadoes
The location and type of the 15 weather and climate disasters in 2016 with losses exceeding $1 billion dollars. The majority of events occurred in the middle of the country form the Central Plains to Texas and Louisiana. Map by NOAA NCEI, adapted by Climate.gov.
Perhaps most surprising were the 4 separate billion-dollar inland flood (i.e., non-tropical) events during 2016, doubling the previous record, as no more than 2 billion-dollar inland flood events have occurred in a year since 1980. Three of these flood events were clustered in Louisiana and Texas between March and August, collectively causing damage approaching $15.0 billion. This is a notable record, further highlighted by the numerous other record flooding events that impacted the U.S. in 2016.

The changing frequency of billion-dollar disaster events
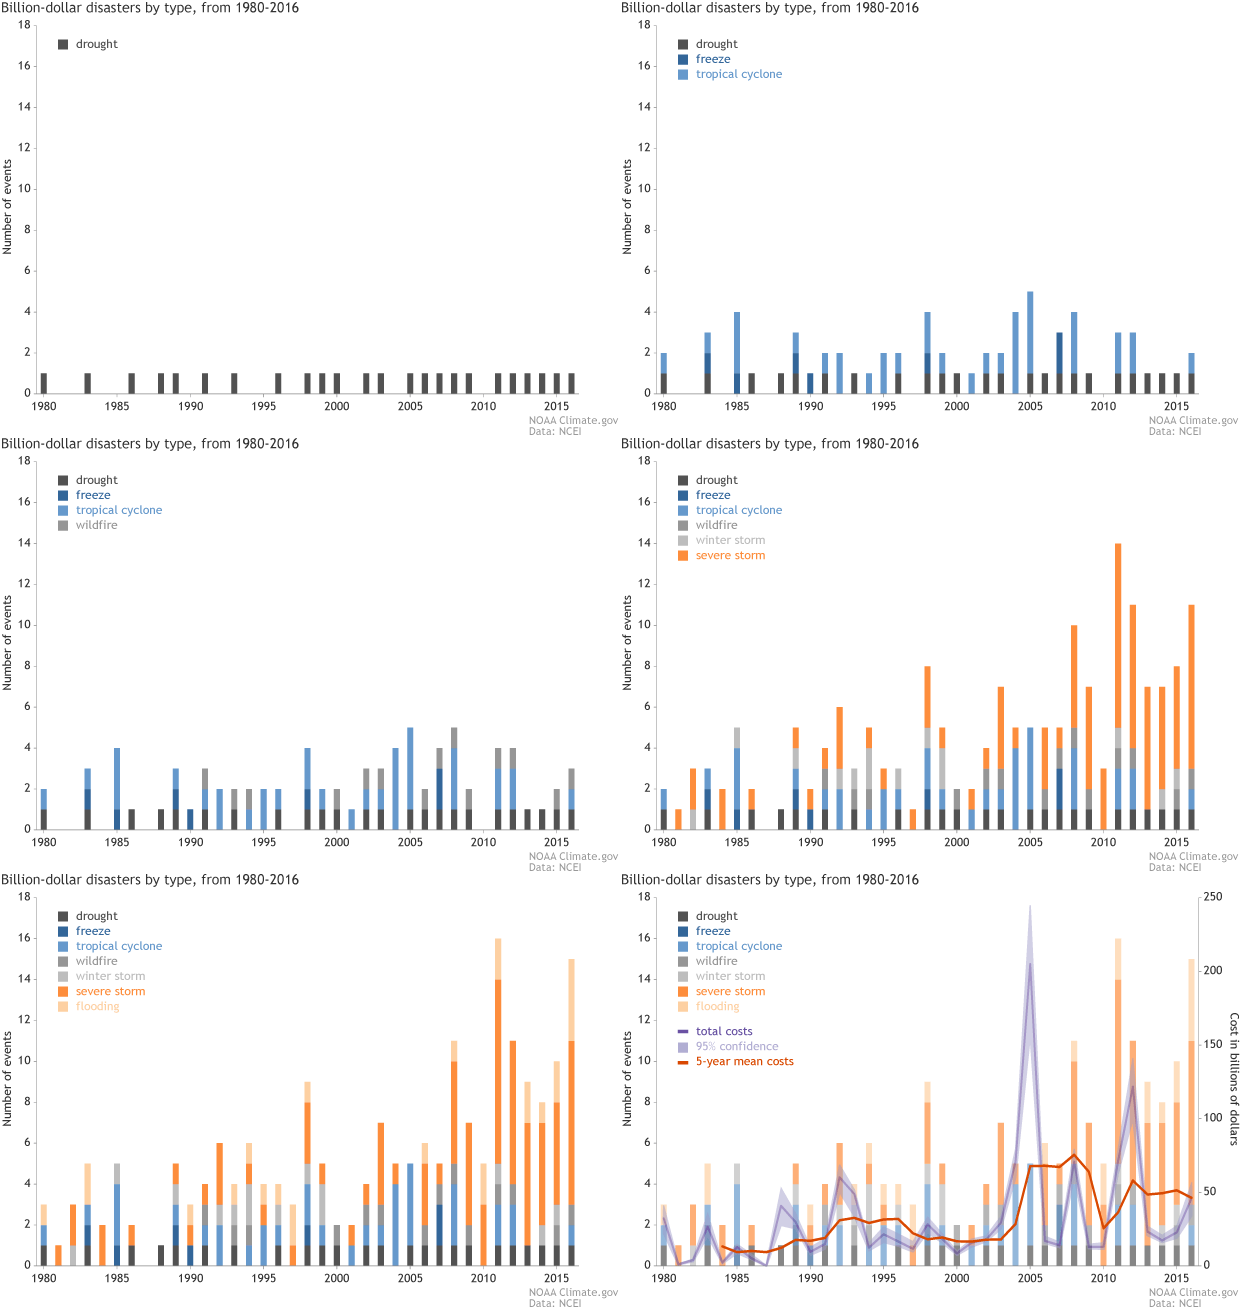
The U.S. has experienced a rising number of events that cause significant amounts of damage. From 1980–2016, the annual average number of billion-dollar events is 5.5 (CPI-adjusted). For the most recent 5 years (2012–2016), the annual average is 10.6 events (CPI-adjusted). The year 2005 was the most costly since 1980 due to the combined impacts of Katrina, Rita, Wilma, and Dennis, as shown in the following time-series. The year 2012 was the second most costly due to the extreme U.S. drought ($30 billion) and Sandy ($65 billion) driving the losses.
animated gif showing each year's billion dollar disasters (1981-2016) with color-coded bars made of different event types
Animation showing the number (bar height) and type (bar color) of billion-dollar weather and climate disasters in the United States since 1980. The purple line shows total annual costs. The red line shows the running 5-year average. NOAA Climate.gov animation adapted from NCEI originals by Adam Smith.

Alaskan Village, Citing Climate Change, Seeks Disaster Relief In Order To Relocate

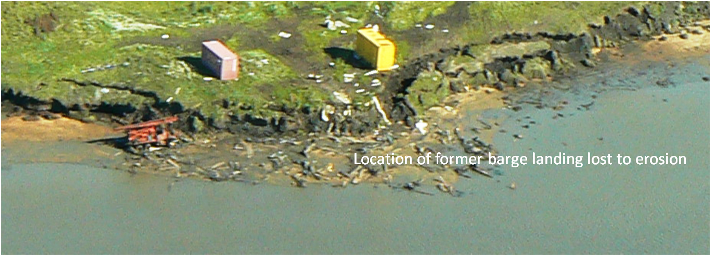
The tiny village of Newtok near Alaska's western coast has been sliding into the Ninglick River for years. As temperatures increase — faster there than in the rest of the U.S. — the frozen permafrost underneath Newtok is thawing. About 70 feet of land a year erode away, putting the village's colorful buildings, some on stilts, ever closer to the water's edge.

Now, in an unprecedented test case, Newtok wants the federal government to declare these mounting impacts of climate change an official disaster. Villagers say it's their last shot at unlocking the tens of millions of dollars needed to relocate the entire community.

"We just need to get out of there," says Romy Cadiente, the village relocation coordinator. "For the safety of the 450 people there."
...
A new village has been chosen 9 miles away, and several houses are already built.

Cadiente says the problem is money: The Army Corps of Engineers has estimated it will cost $80 million to $130 million to relocate key infrastructure.
...
Many of Alaska's villages are dealing with erosion and thawing permafrost. But Newtok's needs may be the most immediate. It has already lost its barge landing, sewage lagoon and landfill. As river water seeps in and land sinks, it expects to lose its source of drinking water this year, and its school and airport by 2020.
...
Usually, the president, with input from the Federal Emergency Management Agency, declares a disaster after a specific catastrophic event. But Newtok is asking for the declaration based on mounting damage from erosion and thawing permafrost over the past decade....
FOR FULL STORY GO TO:
Rachel Waldholz, Alaska Public Media
National Public Radio www.NPR.org
January 10, 2017

Thursday, July 7, 2016

Estimation of climate change damage functions for 140 regions in the GTAP9 database

Abstract:
Climate change damage (or, more correctly, impact) functions relate variations in temperature (or other climate variables) to economic impacts in various dimensions, and are at the basis of quantitative modeling exercises for the assessment of climate change policies. This document provides a summary of results from a series of meta-analyses aimed at estimating parameters for six specific damage functions, referring to: sea level rise, agricultural productivity, heat effects on labor productivity, human health, tourism flows, and households' energy demand. All parameters of the damage functions are estimated for each of the 140 countries and regions in the Global Trade Analysis Project 9 data set. To illustrate the salient characteristics of the estimates, the change in real gross domestic product is approximated for the different effects, in all regions, corresponding to an increase in average temperature of +3°C. After considering the overall impact, the paper highlights which factor is the most significant one in each country, and elaborates on the distributional consequences of climate change.

Tables 7-1 and 7-2 present our estimates, corresponding to an increase in average temperature of +3°C4 for the five categories above and their total algebraic sum. We highlight with a green background color the positive net variations in GDP, with a yellow background moderate reductions (from -1% to -5%) and with a red background the large reductions (below -5%). In addition, we identify, for each country, which among the three types of impact is the one which contributes the most to the overall effect on GDP.5 A quick inspection of Tables 7-1 and 7-2 reveals a number of thought-provoking facts. Only a few countries (Mongolia, Canada, and central-northern European countries, including Russia) are expected to get moderate gains from a +3°C increase in temperature, and these gains are typically due to an increase in tourists' arrivals (and diminished outgoing domestic tourists). Many countries (whose estimates are highlighted in red) are expected to suffer from dramatic reductions in GDP. The most negatively affected countries are Togo in Africa (-18.29%) and Cambodia in South-East Asia (-18.25%), where again Tourism is the most important factor. In addition to tourism income, variations in agricultural and labor productivity are also very relevant in many countries. Sea level rise, on the other hand, never appears as the primary factor, because of its limited incidence on total land and the relative small share of land income on GDP. Remarkably, Tourism is (possibly with Heat) the least studied effect of climate change, maybe because it causes a redistribution of income and wealth, but it has negligible consequences at the global level.
by Roberto Roson and Martin Sartori
The World Bank www.WorldBank.org 
Policy Research Working Paper WPS7728; June 23 2016