Nitrogen waste is identified as a significant threat to global sustainable development, prompting the United Nations to propose halving such waste to reach Sustainable Development Goals (SDGs). This paper uses an integrated assessment framework to quantitatively link nitrogen waste to all 17 UN SDGs, moving beyond previous qualitative analyses. The waste streams include ammonia emissions, nitrous oxide, nitrogen oxides, and water runoff. These pollutants contribute to air and water degradation, soil acidification, and biodiversity loss. The research emphasizes the urgency of implementing management strategies to balance environmental, social, and economic targets by the year 2030.
The analysis concludes that halving nitrogen waste would result in a substantial improvement in global SDG performance. These improvements are driven by better human and ecosystem health as well as more effective climate change mitigation. The study also explores the cost-effectiveness of different control strategies, suggesting that policy choice is critical to the financial feasibility of these goals. While the total costs can be high, the societal benefits are projected to outweigh the expenditures in many scenarios. This research provides essential insights for policymakers looking to develop efficient nitrogen-reduction pathways.
The study reports that halving nitrogen waste could enhance global SDG performance by 19%. The total societal benefit of this reduction is estimated to be as high as US$1,379 billion. On the expenditure side, implementing these control strategies could cost up to US$1,137 billion. However, the authors note that by adopting more cost-effective strategies, these implementation costs could be decreased by up to 72%. These figures demonstrate a clear economic path forward for nitrogen management on a global scale.
He, Peiying, Xiuming Zhang, Chuanzhen Zhang, Binhui Chen, Sitong Wang, Luxi Cheng, Jinglan Cui, et al. "Costs and Benefits of Halving Nitrogen Waste for Global Sustainable Development Goals." *Nature Geoscience* (January 2026). https://doi.org/10.1038/s41561-025-01874-2
Costa Rica's National Decarbonization Plan (NDP) sets the ambitious goal for the country to become carbon-neutral by 2050 and lays out a wide range of policy and institutional reforms to achieve this goal. The authors of this report developed an integrated model that estimates the benefits and costs of implementing the NDP in all major sectors, informed by consultations with numerous government agencies, industries, and nongovernmental organizations, and used it to evaluate whether the NDP makes economic sense for Costa Rica — that is, whether the benefits of the NDP exceed its costs.
The authors' analysis suggests that under the vast majority of plausible assumptions about the future, the NDP would achieve or nearly achieve its greenhouse gas emissions reduction goals and do so at a net economic benefit. Conversely, without a concerted focus and investment in decarbonization, Costa Rica's greenhouse gas emissions will increase substantially.
The findings from this study can play an important role in ensuring that the implementation of the NDP is robust — meaning that it will achieve its goals in the uncertain future. This analysis confirms which lines of action are most critical to the success of the NDP — transport and land use — and identifies some key conditions necessary to achieve close to zero net emissions at a large net economic benefit. This study also offers ideas and models that are valuable for other countries interested in decarbonization, and that can inspire development partners globally.
Key Findings
Under baseline assumptions, decarbonization would yield $41 billion in net benefits to Costa Rica between 2020 and 2050, using a 5 percent discount rate.
Under all but 22 of the more than 3,000 plausible futures considered, implementation of the decarbonization plan would lead to economic benefits that exceed the costs.
Currently, electricity is almost completely renewable, and with modest investments it would provide nearly emissions-free energy to support the electrification of much of Costa Rica's economy.
In the transport sector, significant emissions reductions are possible through electrification of transport and shifting to public transportation. The economic benefits from energy savings, fewer accidents, time saved from reduced congestion, and the reduced negative impacts of air pollution on health more than compensate for the initially higher up-front costs of switching to electric vehicles and building infrastructure for zero-emissions public transport.
Reducing emissions in agriculture and livestock could lead to increased productivity, and increasing carbon sequestration by forests would increase valuable ecosystem services, such as renewable forestry products, water and soil benefits, and support for tourism and cultural heritage.
Emissions reductions from buildings, industry, and the waste sector are also important to reach zero net emissions and together provide modest net benefits through energy cost savings, increased productivity, and the value of treating and recycling and reusing liquid and solid waste.
Recommendations
Costa Rica should continue implementing its NDP to both meet its international obligations to decarbonize and facilitate an economic transition that would very likely lead to large net benefits and contribute to a sustainable COVID-19 pandemic recovery.
As Costa Rica recovers from the COVID-19 pandemic, it should focus on decarbonization investments that would reactivate the economy and provide support to the most critically affected sectors of the economy.
Costa Rica should monitor the costs of alternative-fuel vehicles, as well as the adoption of improved public transportation options, and make adjustments to the transport decarbonization strategies as needed to ensure net economic benefits and sufficient emissions reductions.
As Costa Rica continues to manage its forests for long-term sustainability, it should measure and monitor ecosystem service benefits in order to best target the NDP interventions.
Costa Rica should continue to develop more-detailed proposals for implementing the plan and reevaluate benefits and costs periodically to ensure the greatest net benefits, including by aligning its Nationally Determined Contribution to the NDP.
...
Our analysis suggests that, under baseline assumptions, implementing the NDP would lead to net-zero GHG emissions by 2050 and provide about $41 billion of net benefits across the economy from 2020 to 2050, discounted back to 2015 at a rate of 5 percent per year.3 It would save or otherwise provide $78 billion in benefits, and it would cost about $37 billion. There is significant uncertainty around these estimates, but the analysis shows that under the vast majority of plausible assumptions about the future, the NDP would achieve or nearly achieve its emissions reduction goals and do so at a net economic benefit.
Under baseline assumptions, fully implementing all lines of action in the NDP would lead to about $41 billion in net benefits (Figure S.2). The greatest benefits are due to actions affecting transport, agriculture, livestock, and forestry net emissions. In the agriculture, livestock, and forestry sectors, ecosystem services provided by forests, such as renewable forestry products, water and soil benefits, support for tourism and cultural heritage, and improved yields are worth much more than the investments required to decarbonize and the forgone value of land dedicated to forests—providing discounted net benefits of about $22 billion. The public and private transport sectors together with the freight sector would provide $19 billion in net benefits under baseline assumptions, since the economic benefits from energy savings, fewer accidents, time saved from reduced congestion, and the reduced negative impacts of air pollution on health more than compensate for the initially higher up-front costs of switching to electric vehicles and building infrastructure for public transport (Godínez-Zamora et al., 2020). Efficiency gains in industry, and the economic value of recycled materials and treated wastewater, result in a small net benefit for the industry and waste sectors: $1.3 billion together. Figure S.2 shows modest net costs for the electricity and buildings lines of actions. However, the benefits of cheaper electricity are accounted for under the transport, industry, and buildings sectors.
by David G. Groves, James Syme, Edmundo Molina-Perez, Carlos Calvo Hernandez, Luis F. Víctor-Gallardo, Guido Godinez-Zamora, Jairo Quirós-Tortós, Felipe De León, Andrea Meza Murillo, Valentina Saavedra Gómez, Adrien Vogt-Schilb
This paper considers the treatment of co-benefits in benefit-cost analysis of federal air quality regulations. Using a comprehensive data set on all major Clean Air Act rules issued by the Environmental Protection Agency over the period 1997-2019, we show that (1) co-benefits make up a significant share of the monetized benefits; (2) among the categories of co-benefits, those associated with reductions in fine particulate matter are the most significant; and (3) co-benefits have been pivotal to the quantified net benefit calculation in exactly half of cases. Motivated by these trends, we develop a simple conceptual framework that illustrates a critical point: co-benefits are simply a semantic category of benefits that should be included in benefit-cost analyses. We also address common concerns about whether the inclusion of co-benefits is problematic because of alternative regulatory approaches that may be more cost-effective and the possibility for double counting.
The EPA regulatory program consistently delivers the greatest monetized benefits and imposes the largest costs of any federal regulatory agency’s actions (e.g., OMB 2019). To provide context for an assessment of co-benefits, Figure 2 illustrates the net social benefits for the CAA regulations in our database. The median rule has about $4.1 billion in net social benefits, based on the average of the lower and upper bounds of benefits and costs for that regulation’s snapshot of a full-implementation year. Every rule has positive net social benefits, with five exceptions: (1) the 1997 NAAQS for ozone (RIN 2060-AE57), with an estimated -$6 billion in net social benefits; (2) the 1997 medical waste incinerator standards (RIN 2060-AC62), with an estimated -$125 million in net social benefits; (3) the 2008 NAAQS for lead (RIN 2060-AN83), with an estimated -$90 million net social benefits15; (4) the 2005 mercury power plant rule (RIN 2060-AJ65), with an estimated -$1 billion in net social benefits; and (5) the 2016 new source performance standards for methane at oil and gas operations (RIN 2060-AS30), with an estimated -$200 million in net social benefits.
We find that co-benefits account for about 46 percent of the monetized benefits on average across all RIAs. As Figure 3 illustrates, this average masks considerable heterogeneity among the rules. Some rules have no monetized co-benefits, such as the 2013 fine PM NAAQS and the 2014 Tier 3 motor vehicle and emissions standards, which targeted both fine PM and ozone. Other rules, especially several of those focused on HAPs, have zero monetized benefits for the targeted pollutant. In these cases, fine PM pollution reductions are the primary, if not exclusive, source for monetized benefits. For the three joint EPA-NHTSA regulations targeting carbon dioxide emissions and fuel economy (RINs 2060-AP61, 2060-AQ54, and 2060-AS16), we consider reduced fuel costs one of the target benefits of the regulation, given NHTSA’s statutory authority. If, however, we were to consider reduced fuel costs a co-benefit from the standpoint of EPA under its Clean Air Act authority, then about $130 billion of benefits over 2011-2016 would shift and several of the dark gray bars at the bottom of Figure 3 would fall substantially.
by Joseph E. Aldy, Matthew Kotchen, Mary F. Evans, Meredith Fowlie, Arik Levinson and Karen Palmer
The Paris Climate Agreement aims to keep temperature rise well below 2 °C. This implies mitigation costs as well as avoided climate damages. Here we show that independent of the normative assumptions of inequality aversion and time preferences, the agreement constitutes the economically optimal policy pathway for the century. To this end we consistently incorporate a damage-cost curve reproducing the observed relation between temperature and economic growth into the integrated assessment model DICE [ Dynamic Integrated Climate-Economy model]. We thus provide an inter-temporally optimizing cost-benefit analysis of this century’s climate problem. We account for uncertainties regarding the damage curve, climate sensitivity, socioeconomic future, and mitigation costs. The resulting optimal temperature is robust as can be understood from the generic temperature-dependence of the mitigation costs and the level of damages inferred from the observed temperature-growth relationship. Our results show that the politically motivated Paris Climate Agreement also represents the economically favourable pathway, if carried out properly.
...
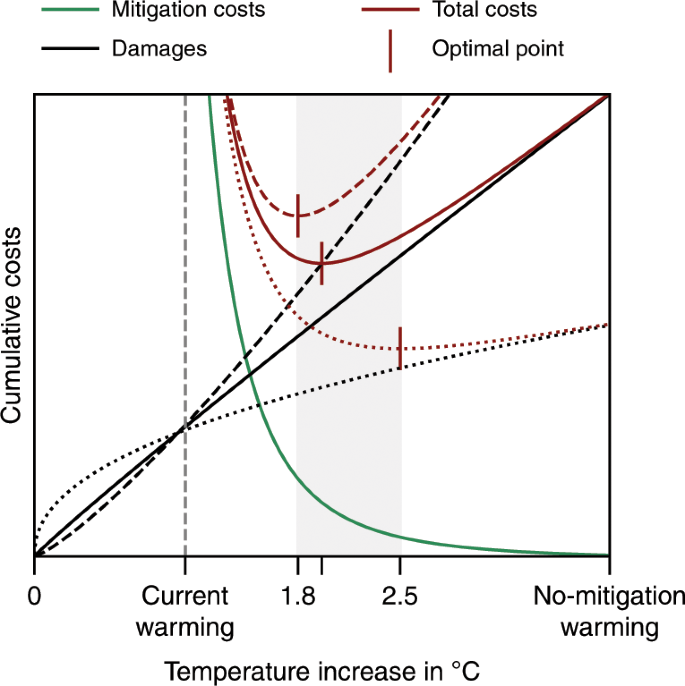
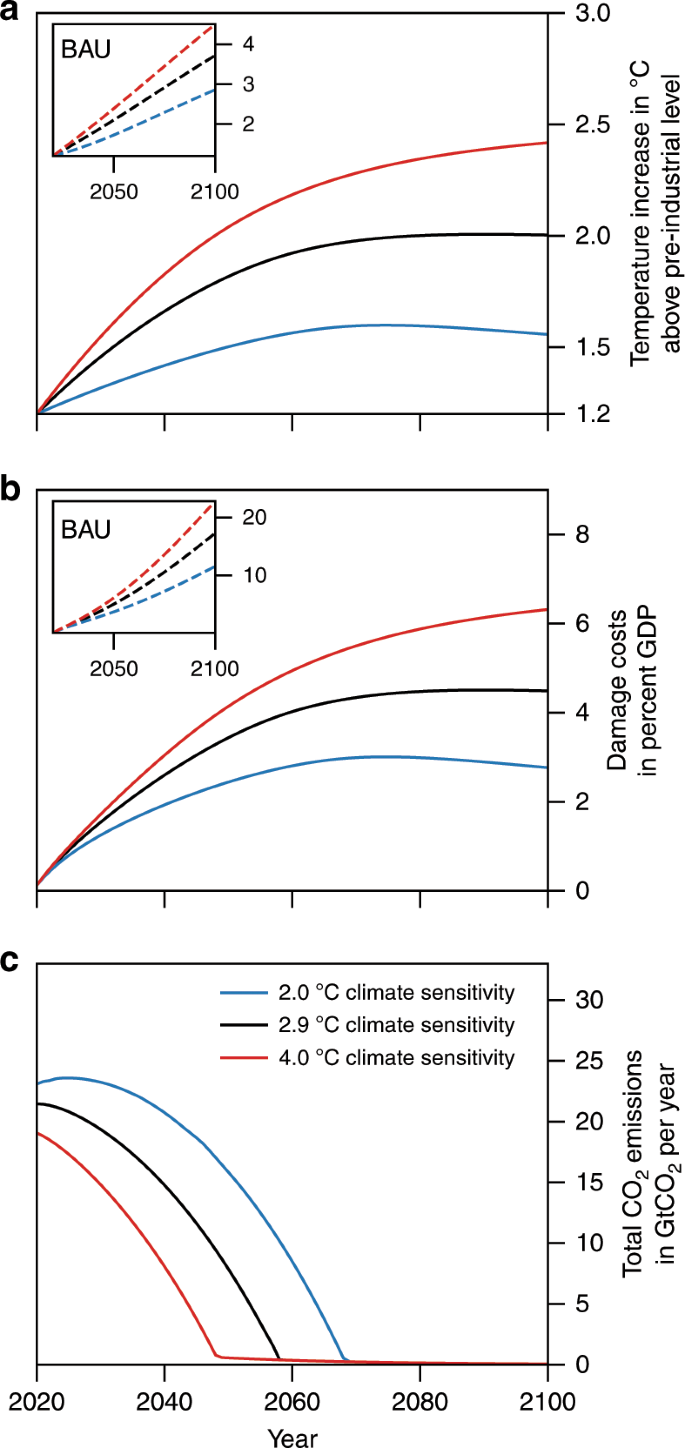
[The authors] find that the 2 °C target represents the cost-benefit optimal temperature for the base calibration (Fig. 2a). This calibration involves the best estimate8 of the temperature–economic growth relation in the past and the original ECS [equilibrium climate sensitivity] value in DICE-2013 of 2.9 °C, which is at the centre of estimates for several decades. Higher ECS values shift the level of target warming for which the mitigation-cost curve diverges to infinity to higher values (Fig. 1), i.e. they incur substantially higher mitigation costs. For ECS of 4 °C, for instance, the 2 °C target becomes too costly. Yet, with an optimal target warming of 2.4 °C the deviation from this target is not large. For smaller ECS values, e.g. of 2 °C, limiting warming further to well below 2 °C is economically optimal. Regardless of the exact ECS, the optimal mitigation efforts promise a significant damage reduction compared to the BAU [business-as-usual] scenario (~14% for ECS of 4 °C, ~10% for ECS of 2.9 °C, and ~8% for ECS of 2 °C). These efforts are, as also claimed by the Paris Agreement, ambitious (Article 3)1 and involve very stringent measures from the outset (Fig. 2c).
Fig. 1: Illustration of universality of the cost-benefit climate analysis.
Cumulative mitigation costs (green curve) and climate damages (black curve) as a function of Earthʼs warming level give the total climate costs (red curve). Mitigation costs diverge for present-day warming and converge to zero for unmitigated warming. The damages are zero for zero warming and increase with temperature. The characteristic steepness of the mitigation curve implies that beyond a certain damage level the economically optimal temperature (which minimizes the total costs) becomes insensitive to a further increase in damages. For example, increasing (black dashed) or decreasing (black dotted) the damage level by half of the initial damage level does not change the economically optimal warming level significantly (grey area).
Fig. 2: Temperature increase, damage costs, and carbon emissions under cost-benefit optimal policy for three different climate sensitivities.
The black curves are associated with the original calibration of the climate sensitivity of 2.9°C; the blue curves with a 2°C climate sensitivity and the red curve with a 4°C climate sensitivity. The inset figures allow comparing the economically optimal temperature development and damage costs with their corresponding values in the BAU scenario.
Renewable portfolio standards (RPS) exist in 29 US states and the District of Columbia. This article summarizes the first national-level, integrated assessment of the future costs and benefits of existing RPS policies; the same metrics are evaluated under a second scenario in which widespread expansion of these policies is assumed to occur. Depending on assumptions about renewable energy technology advancement and natural gas prices, existing RPS policies increase electric system costs by as much as $31 billion, on a present-value basis over 2015−2050. The expanded renewable deployment scenario yields incremental costs that range from $23 billion to $194 billion, depending on the assumptions employed. The monetized value of improved air quality and reduced climate damages exceed these costs. Using central assumptions, existing RPS policies yield $97 billion in air-pollution health benefits and $161 billion in climate damage reductions. Under the expanded RPS case, health benefits total $558 billion and climate benefits equal $599 billion. These scenarios also yield benefits in the form of reduced water use. RPS programs are not likely to represent the most cost effective path towards achieving air quality and climate benefits. Nonetheless, the findings suggest that US RPS programs are, on a national basis, cost effective when considering externalities.
Range of benefit and cost estimates for the Existing RPS Policies and High RE scenarios, relative to the Reference scenario. Note that negative values in the figure indicate increased costs and that the central values for the air quality and the climate damage benefits are highlighted with a bolded marker.
by Ryan Wiser 1 and 3, Trieu Mai 2, Dev Millstein 1, Galen Barbose 1, Lori Bird 2, Jenny Heeter 2, David Keyser 2, Venkat Krishnan 2 and Jordan Macknick 2
1. Lawrence Berkeley National Laboratory. 1 Cyclotron Road, Berkeley, CA 94720, United States of America
2. National Renewable Energy Laboratory. 15013 Denver West Parkway, Golden, CO 80401, United States of America
3. Author to whom any correspondence should be addressed RHWiser@lbl.gov
Federal climate regulations are currently under attack, in part due to the perception that these regulations will impose excessive costs on regulated industries and society as a whole. But according to federal projections, the benefits of these regulations would significantly outweigh the costs. In a new paper, we added up the projected economic impacts of major federal rules aimed at reducing greenhouse gas emissions and found that the net benefits could reach nearly $300 billion per year by 2030. The rules will also generate a variety of non-monetized benefits, such as improved public health outcomes and the creation of jobs, as well as climate mitigation benefits that will extend well beyond 2030.
Jessica Wentz and Nadra Rahman analyzed the projected economic impacts of major regulations aimed at controlling carbon dioxide and methane: U.S. EPA’s Clean Power Plan, the Bureau of Land Management’s Methane and Waste Prevention Rule, EPA’s 2016 New Source Performance Standards for the oil and gas sector, and EPA’s emissions standards for both light-duty and heavy-duty vehicles.
Rahman and Wentz primarily aggregated EPA and Interior’s own cost-benefit projections of the Obama-era regulations. They also compared the values to separate cost-benefit analyses developed by independent researchers, a number of whom challenged the agencies’ analyses of the regulations, alternately stating that EPA and BLM had overestimated benefits or underestimated costs.
The $370 billion in gross benefits includes the positive impacts of reducing 980 million metric tons of carbon dioxide equivalent by 2030, along with the health benefits of also reducing other pollutants, such as nitrogen oxides.
These benefits would be four times greater than the projected $84 billion in total costs of implementing major regulations crafted under the Obama administration, said researchers in a paper published on the center’s website yesterday.
On a year-to-year basis, the economic benefits can either significantly exceed, or at the very least match, the cost of implementation. Some of the highest potential benefits come from implementing the Clean Power Plan and from standards for medium- to heavy-duty vehicles. The total does not include other benefits like job creation and long-term climate change mitigation benefits.
Clean Power Plan
Based on EPA’s estimates, the net economic benefits of the rule could be around $7 billion in 2020, and then rise to $46 billion in 2030. These figures included: compliance costs, an estimated reduction of 74 million metric tons of CO2 emissions in 2020 and a reduction of 375 million metric tons in 2030. The dollar values also counted health benefits resulting from the reduction of other pollutants like sulfur dioxide and nitrogen oxides. The economic benefits don’t include other potential positives of the rule like avoided premature deaths, lower exposure to hazardous air pollutants and impacts on ecosystems.
The researchers note that the economic benefits are calculated using a social cost of carbon, a complex metric that puts a dollar value on the emission of 1 ton of carbon. The value takes into account how rising global temperatures will affect the planet and society. In the president’s “energy independence” executive order, Trump signaled that the administration would seek to alter this method of calculating the costs of climate change, though agencies could use a related metric that would only take into account domestic impacts of climate change.
Motor Vehicle Emissions
Light-duty vehicles: The fuel efficiency improvements alone for light-duty vehicles are enough to offset the costs of implementing rules on emissions from these vehicles, according to the EPA figures the researchers cited. The net economic benefits of fuel efficiency standards for model years 2012 to 2016 are expected to be $34.7 billion in 2020 and $100.4 billion in 2030. Meanwhile, standards for model years 2017 through 2025 could lead to net benefits of $168 billion in 2020 and $81.4 billion in 2030. Medium and heavy-duty vehicles: According to EPA data, phase one of emissions standards for these vehicles, for model years 2014 to 2018, could lead to net benefits of $10 billion in 2020 and $27.3 billion in 2030. Phase two, for model years 2019 to 2028, could have net benefits of $31.5 billion in 2020 and $74.4 billion in 2030.
New Source Performance Standards for the Oil and Gas Sector
As with the Clean Power Plan, EPA used the social cost of carbon metric to calculate the net monetary benefits of controlling methane, volatile organic compounds and toxic air pollutants emitted from new and modified sources. The net benefits of the rule could be $37 million by 2020 and go up to $180 million in 2025. These numbers consider compliance costs and methane emissions reductions of 300,000 short tons in 2020 and 510,000 short tons in 2025. Not all benefits were included. EPA did not put a dollar value on the health benefits of potential reductions in ozone, which is formed from volatile organic compounds. Estimates also did not include potential natural gas savings from captured methane.
Over the past decade, the notion of resilience has emerged as a prevailing paradigm for planning that considers how people and places can survive, adapt, and grow in the face of today’s pressures, where globalization, urbanization, and climate change have combined to increase our vulnerability to a range of shocks and stresses.
Given the tremendous interest in and commitment to building resilience, we need tools that help communities illustrate and quantify the link between resilience-inspired investments and improved well-being.
The net benefits from these investments are the resilience dividend.
Building resilience is about people and places being better prepared to withstand catastrophic events—both natural and manmade—and able to recover more quickly and emerge stronger when those events occur. It may also provide additional benefits even in the absence of those events.
The resilience dividend is the sum of benefits, over time, from a project investment based on resilience principles compared to one that is not.
It is the difference in value between a resilience approach and business-as-usual - the “bonus” we receive from investing in a project designed to build resilience.
The Rockefeller Foundation, which has invested more than half a billion dollars in resilience-building over the past decade, received an overwhelming number of requests for how to quantify the resilience dividend.
With support from the Foundation, the RAND Corporation developed the “Resilience Dividend Valuation Model”, a framework that provides communities with a structured way to frame and analyze resilience policies and projects.
The Resilience Dividend Valuation Model combines elements of project evaluation and economic valuation, and can be used to guide decision-making, planning, and action for resilience investments.
It offers a framework for policy makers and practitioners to carefully map out how a resilience investment will affect a community and its well-being.
It helps stakeholders understand and illustrate the causal relationships between elements of human and natural systems that are unavoidably complex and evolve over time.
It assesses how resilience investments will shape outcomes and how valuable these outcomes might be to stakeholders that operate within the system. This mapping provides the basis for estimating the net benefits of the investment.
What do communities gain from adopting resilience approaches?
There are two main benefits from resilience approaches:
lower future costs from a shock (or set of shocks) or stressors; and
social, economic and environmental co-benefits even in the absence of a shock or stress. Co-benefits include enhanced social cohesion, better environmental quality and ecosystem services, and additional public goods (for example, space for public use).
Valuing the additional benefits from a resilience project requires that we understand how resilience policy and program interventions change the vital elements of a system over time.
These elements include the resources a community has, the goods and services those resources provide, and how those goods and services drive the level of well-being. It also requires an understanding of how stakeholders in the system might behave in response to changes in system elements.
Resilience investments can change the resources a community has, relax constraints, or increase opportunities for stakeholders.
The linkages between elements of a system are critical, since they can be leveraged to create additional co-benefits and complementarities.
The RAND team completed a series of case studies designed to both demonstrate how the Resilience Dividend Valuation Model can be applied, and to draw out lessons learned about the challenges and opportunities of estimating the resilience dividend.
One of the case studies looked at investments in climate adaptive infrastructure and social systems in eight towns in Bangladesh.
The goal of these investments, which was co-financed by the Asian Development Bank (ADB), was to improve long-term outcomes related to natural disasters by investing in physical infrastructure, supporting community decision-making, and enhancing municipal government capacity through a multi-year project.
Although the Bangladesh projects are not yet complete, RAND applied the Resilience Dividend
Valuation Model using a pre-project approach to estimate the expected resilience dividend.
Using ADB data, RAND analyzed the goods and services the projects will produce, ranging from water quality and flood protection to general economic activity and municipal services, and the team looked at how those goods and services will be allocated, including through gender-inclusive decision making.
Estimating the full resilience dividend required more data than was available, yet the case highlighted the opportunities for using the model to gauge the potential impacts of resilience investments.
The Foundation’s support to RAND resulted in a modeling framework that offers us a starting point – one that can be built upon through collective expertise, as well as trial-and-error.
We’ve learned a lot from trying to estimate the resilience dividend of an investment and have concluded that quantifying the resilience dividend of an investment:
Is a skill and an iterative process, not an equation or a black box.
Takes rigorous systems analysis, and is challenging especially when there is no shock.
Is a data- intensive endeavor: quantitative and qualitative data are critical to arriving at an estimation of the dividend.
Demands capturing critical elements beyond economic and financial benefits: social capital, for example, is important for behavior change within a system and critical to valuing the dividend.
Requires a careful study of distributional effects: a positive resilience dividend does not necessarily imply positive net benefits for all stakeholders.
The RAND team, in conjunction with Rockefeller, produced two documents to support those looking to implement the Resilience Dividend Valuation Model.
The Practitioner Guide walks through the motivation and mechanics of the model to introduce the framework and approach.
A more detailed report, including technical explanations, is available for those interested in delving deeper into the approach and features six detailed case studies designed to explain how the model can be applied across settings, as well as the opportunities and challenges of calculating the resilience dividend.
San Francisco International Airport (SFO) is undergoing a $2.4 billion renovation of Terminal 1 in order to add capacity at one of the busiest U.S. airports and one of the fastest growing in the world. The designs for that renovation are being informed by Autocase®, a brand new software tool that automates "Triple Bottom Line Cost Benefit Analysis (TBL- CBA)" for buildings and sites.
"We have set ambitious goals to excel in passenger experience and health and to meet California's net zero energy requirements," said San Francisco International Airport's Chief Development Officer, Geoff Neumayr. "To do so, we needed to simulate and compare the impacts of possible investments in different building elements, from green roofs to dynamic window glazing to motorized windows to geothermal heat pumps. But I wanted to see those impacts in dollars and cents, and to feel assured we knew how they would affect our 53 million annual passengers and 30,000 employees."
So SFO required that their Design-Build teams, some of the best in the world like Austin Webcor Joint Venture + HKS/WB/ED2/KYA, evaluate each design element through a "comprehensive business case analysis" inclusive of "costs and benefits for all three bottom lines – financial, social, and environmental." "To begin with, together with the Autocase team, we assessed 6 possible design features for Boarding Area B," said Raphael Sperry of Arup, one of the key consultants on the project. "The green roof had a particularly compelling Triple Bottom Line Cost Benefit Analysis (TBL- CBA) - of $5 million over a 50-year timespan, supporting its inclusion in the project. In contrast, the ROI for the ground source heat pump was negative financially (TBL-CBA of -$5.23 million), and the analysis showed that level of investment was not outweighed by its environmental and social benefits. While ground source is an attractive technology, it's not appropriate for every project, and this allowed us to put our resources where they will have a bigger overall impact."
This paper sets out a framework to evaluate the welfare impacts of residential energy efficiency programs in the presence of imperfect information, behavioral biases, and externalities, and then estimates key parameters using a 100,000-household field experiment. Several results run counter to conventional wisdom: we find no evidence of informational or behavioral failures thought to reduce program participation; there are large unobserved benefits and costs that traditional evaluations miss; and realized energy savings are only 58 percent of predictions. In the context of the model, the two programs we study reduce social welfare by $0.18 per subsidy dollar spent, both because subsidies are not well-calibrated to currently-estimated externality damages and because of self-selection induced by subsidies that attract households whose participation generates low social value. However, the model predicts that perfectly-calibrated subsidies would increase welfare by $2.53 per subsidy dollar, revealing the potential of energy efficiency programs....
Even before quantifying welfare effects, the program evaluation process generates several important empirical results. First, in the randomized experiment, there is no evidence of the hypothesized informational or behavioral failures. Within the letter variations, only price mattered: while a $100 audit subsidy increased takeup by 32 percent relative to control, all six informational and behavioral variations had statistically and economically insignificant effects.
...
Non-experimental investment takeup estimates imply that households that had audits were willing to pay an average of $330 for the unobserved attributes of a recommended investment, perhaps due to "warm glow" from contributing to externality reduction or from the improved comfort of a weatherized home. Furthermore, post-audit investment takeup was remarkably inelastic to monetary benefits and costs: consumers did not take up 40 percent of investments with private internal rates of return (IRRs) greater than 20 percent, and they did take up 36 percent of investments with negative private IRRs. This inelasticity implies that consumers perceive a wide dispersion in unobserved benefits and costs. These results highlight the importance of using revealed preference approaches to welfare analyses, instead of conventional accounting approaches that consider only observed monetary factors
...
We estimate that realized energy savings fell well short of predictions. Specifically, the programs’ simulation models predicted that the average household that had an audit made investments that would save $153 per year at retail prices, or about 8.5 percent of baseline energy expenditures. In contrast, we estimate an average savings of $89 per year, implying a "realization rate" of 58 percent. The shortfall cannot be explained by temporary weather patterns and is far too large to be caused by a "rebound effect" (i.e. increased utilization in response to the decreased cost of energy services).
...
The social internal rate of return (including externality reductions) of investments made through the programs is negative 4.1 percent using the empirical estimates of energy savings. To help address the question of whether these results generalize outside the two Wisconsin programs, Appendix E presents a parallel analysis using data from 37 Better Buildings program sites nationwide. We find that the national programs had slightly worse IRRs than the Wisconsin programs.
...
The full paper is currently available free of charge at:
Abstract:
Since the 1972 U.S. Clean Water Act, government and industry have invested over $1 trillion to abate water pollution, or $100 per person-year. Over half of U.S. stream and river miles, however, still violate pollution standards. We use the most comprehensive set of files ever compiled on water pollution and its determinants, including 50 million pollution readings from 170,000 monitoring sites, to study water pollution's trends, causes, and welfare consequences. We have three main findings. First, water pollution concentrations have fallen substantially since 1972, though were declining at faster rates before then. Second, the Clean Water Act's grants to municipal wastewater treatment plants caused some of these declines. Third, the grants' estimated effects on housing values are generally smaller than the grants' costs....
The share of waters that are not fishable fell on average by about half a percentage point per year, and the share that are not swimmable fell at the same rate. In total over the period 1972-2001, the share of waters that are not fishable and the share not swimmable each fell by 11 percentage points. Each of the four pollutants which are part of these fishable and swimmable definitions declined rapidly during this period. Fecal coliforms had the fastest rate of decrease, at 2.8 percent per year. BOD, dissolved oxygen deficits, and total suspended solids all declined more slowly, at about 1.5 percent per year.
Trends in all these pollutants since the Clean Water Act are large, but trends before the Clean Water Act were larger. For example, BOD was falling by 3 percent per year before the Clean Water Act and 1.5 percent after it. We find pre/post 1972 trend breaks of comparable magnitudes for all the other pollutants. We interpret these pre-1972 trends somewhat cautiously since, as discussed earlier, relatively few monitoring sites recorded data before the 1970s, and fewer long-term monitoring sites operated in the 1960s.
...
We find that [Clean Water Act] grants cause large and statistically significant decreases in pollution. Each grant decreases dissolved oxygen deficits by 0.8 percentage points, and decreases the probability that downstream waters are not fishable by 0.7 percentage points. The other pollutants decrease as well | BOD falls by about3.4 percent, fecal coliforms fall by 8.5 percent, and the probability that downstream waters are not swimmable by about half a percentage point. The point estimate implies that each grant decreases TSS by one percent, though is imprecise. TSS comes primarily from non-point sources like agriculture and urban runoff, so is less closely related to municipal wastewater. Event study graphs support these results. These graphs are estimated from specifications corresponding to equation. In years before a grant, the coefficients are all statistically indistinguishable from zero, have modest magnitude, and have no clear trend.... This implies that pollution levels in upstream and downstream waters had similar trends before grants were received. In the years after a grant, downstream waters have 1-2 percent lower dissolved oxygen deficits, and become 1-2 percent less likely to violate fishing standards. These effects grow in magnitude over the first ten years, are statistically significant in this period, and remain negative for about 30 years after a grant.
...
The cost to increase dissolved oxygen saturation in a river-mile by 10 percentage points.... .The simplest specification ... implies that it cost $0.57 million per year to increase dissolved oxygen saturation in a river-mile by ten percent; the broadest specification ... implies that it cost $0.54 million per year. The annual cost to make a river-mile fishable ranges from $1.8 million in the simplest specification ... to $1.5 million in the richest specification.... The grants program made 16,000 river-miles fishable.
...
The estimates ... are generally consistent with near complete pass-through, i.e., little or no crowding out or in beyond the required municipal capital copayment. The Panel A pass-through estimates range from 1.15 to 1.27 in real terms or 1.53 in nominal, which mean that city expenditure increased by around the amount of the typical copay (which was typically a third of the federal grant). Panel B ... includes the local copayment in the main explanatory variable,... and the estimates imply pass-through rates of 0.86 to 0.94 in real terms or 1.09 in nominal terms.
,,,
Table 5 analyzes how Clean Water Act grants affect housing. Column (1) shows estimates for homes within a quarter mile of downstream waters. Column (2) adds controls for dwelling characteristics, and for baseline covariates interacted with year fixed effects. Column (3) include all homes within 1 mile, and column (4) includes homes within 25 miles.
Panel A reports estimates of how grants affect log mean home values. The positive coefficients in the richer specifications of columns (2) through (4) are consistent with increases in home values, though most are statistically insignificant. Column (4) implies that each grant increases mean home values within 25 miles of affected waters by three hundredths of a percentage point. The 0.25 or 1.0 mile estimates are slightly larger than the 25 mile estimate, which is consistent with the idea that residents nearer to the river benefit more from water quality. Panel B analyzes how grants affect log mean rental values. These estimates are generally smaller than the estimates for housing. The estimate in column (4), including homes within a 25 mile radius of downstream rivers, is small but actually negative.
Panels A and B reflect the classic hedonic model, with fixed housing stock. Panels C and D estimate the effect of grants on log housing units (panel C) or the log of the total value of the housing stock (panel D). In the presence of elastic housing, measuring only price effects (as in Panels A and B) could understate willingness-to-pay for local amenities. Moreover, many cities have had substantial waterfront development, which could be related to water quality.
Panels C and D suggest similar conclusions as Panels A and B. Most of these estimates are small and actually negative. One is marginally significant (Panel C, column 1), though the precision and point estimate diminish with the controls of column (2). Column (4) in of Panel D literally implies that each grant decreases the total value of the housing stock within a 25 mile radius of downstream waters by one point five hundredths of a percentage point.
Figure 4 shows event study graphs, which suggest similar conclusions as these regressions. Panel A shows modest evidence that in the years after a plant receives a grant, the values of homes within 0.25 miles of the downstream river increase. The increases are statistically insignificant in most years and small in magnitude. Panel B shows no evidence that homes within 25 miles of the downstream river increase after a treatment plant receives a grant.
We also report a range of sensitivity analyses, which are broadly in line with the main results.
...
Considering all owner-occupied homes within 25 miles of the river, the estimated ratio of the grants aggregate effects on home values to the grants’ costs is 0.25. Adding rental units in column (3) does not change this estimate out to two decimal points.
... Under [the] ... three approaches, the ratios of measured benefits to costs are -0.11 (0.16), 0.11 (0.31), and 0.11 (0.10), respectively.
... Row 8 finds that grants to declining urban areas have slightly lower ratios, while the ratio for high amenity areas is greater. Finally, row 9 tests for differences in the housing market response by census region. This specification finds that grants to the Northeast have smaller ratios, while grants to the south have larger ratios around 0.73. None of these ratios in rows 6-9 are significantly different than that of the mean grant.
The map in Appendix Figure 10 shows heterogeneity in the ratio of measured benefits to costs across U.S. counties. This map assumes the same hedonic price function nationally and reflects spatial heterogeneity in the density of housing units. Specifically, these estimates divide treatment plants into ten deciles of the number of people in 2000 living within 25 miles of downstream river segments. They then use the regression estimates from column 4 of Table 5 to calculate the ratio of the change in the value of housing and grant costs, separately for each decile.39 Finally, we average this ratio across all plants in each county.
The map shows that the ratio of measured benefits to costs is much larger in more populated counties. The bottom decile of counties, for example, includes ratios of measured benefits to costs of below 0.01. The top decile of counties includes ratios between 0.31 and 0.45. Grants and population are both highly skewed|37 percent of grant costs and 54 percent of population are in the top decile.
We take three overall conclusions from this analysis of heterogeneity. First, we find suggestive evidence that ratios of measured benefits to costs follow sensible patterns, though not all estimates are precise Second, none of these subsets of grants considered has a ratio of measured benefits to costs above one, though many of the confidence regions cannot reject a ratio of one. The largest ratios of estimated benefits to costs are for areas where outdoor fishing or swimming is common (ratio of 0.57), for high amenity urban areas (ratio of 0.63), and in the South (ratio of 0.74).
Amid concerns about the economic and employment impacts of California’s ambitious climate policies, the first comprehensive, academic study of their effects in the San Joaquin Valley has found a total economic benefit of $13.4 billion. The study, The Economic Impacts of California’s Major Climate Programs on the San Joaquin Valley, addresses compliance and investment costs as well as the benefits across the region, and finds a net boost to the Valley’s economy from the state’s major climate programs, including the creation of tens of thousands of jobs. The Valley is especially vulnerable to air quality problems that climate policies tend to alleviate. But it also faces more socioeconomic challenges than other parts of the state and is less equipped to take chances with its economy.
“This report shows that even in one of the poorest and most disadvantaged regions of the state and nation, California’s existing climate policies can provide net economic benefits,” said Ethan Elkind, who coordinated the report for the Center for Law, Energy and the Environment (CLEE) at the UC Berkeley School of Law.Researchers looked at three key California climate and clean energy policies: 1) cap-and-trade, which established a market designed to reduce carbon emissions from major polluters; 2) the Renewables Portfolio Standard (RPS), which calls for California to get 33 percent of its energy from renewable sources by 2020, growing to 50 percent by 2030; and 3) energy efficiency programs run by investor-owned utilities and overseen by the Public Utilities Commission....
Cap-and-Trade
After accounting for compliance and other costs, the UC researchers estimate the cap-and-trade program had a direct economic benefit of $119 million to the San Joaquin Valley, and boosted the economy by $200 million when you include indirect and induced economic benefits. If you include spending that has been allocated but not yet disbursed, those numbers rise to $1 billion in direct economic benefits and $1.5 billion when including indirect economic benefits.
Proceeds from carbon auctions disbursed in the region so far have largely gone towards initial work on the state’s high-speed rail project, affordable housing, irrigation modernization and electric vehicle incentives. The study found that industries benefiting from the investment of cap-and-trade revenue, such as construction, generate more economic activity in the region than those industries bearing the costs of cap-and-trade compliance.
Researchers calculated a potential negative impact on 400 jobs due to compliance, but found that on a net basis, more than 700 jobs were created directly, and more than 1,600 supporting service and industry jobs were created indirectly, from 2013 through 2015. In the same period, state and local tax revenues received a $4.7 million boost.
Renewables Portfolio Standard
A lot of attention is paid to the state’s carbon cap-and-trade program, but in terms of the San Joaquin Valley’s economy, the state’s Renewables Portfolio Standard (RPS) has had a bigger impact so far. Construction on renewable energy projects has resulted in $11.6 billion in total economic activity in the Valley.
The San Joaquin Valley is home to 24 percent of the state’s solar generation and 54 percent of the state’s wind generation, providing significant employment opportunities in the region.
“Building and operating renewable energy facilities means jobs,” Jones said. From 2002 to 2015, renewable programs created about 31,000 direct jobs in the San Joaquin Valley – for people building and operating renewable energy facilities, for example – and created another 57,000 indirect and induced jobs for suppliers, supporting businesses and the like, for a total of 88,000 jobs. “Most of these direct jobs are the well-paid, local, career-track jobs the Valley really needs,” concluded Jones.
Energy Efficiency Programs
The report found energy efficiency programs overseen by the California Public Utilities Commission (CPUC) are cost-efficient vehicles for families, businesses and institutions to save energy and money year after year. By cutting demand, efficiency efforts also reduce the need for costly new power-generating infrastructure.
Energy efficiency programs in the San Joaquin Valley are the most cost-effective in the state, according to the report authors’ analysis of data reported by the CPUC. The report’s researchers found these programs in the Valley have provided net economic benefits of $248 million since 2010.
“Energy efficiency programs are job creators,” Jones said. “From 2006 to 2015, utility energy efficiency programs created 6,700 direct jobs, two-thirds of them in the construction industry and 10,700 indirect and induced jobs in the Valley, for a total of 17,400 jobs.“
Exploiting geological variation within shale deposits and timing in the initiation of hydraulic fracturing, this paper finds that allowing fracking leads to sharp increases in oil and gas recovery and improvements in a wide set of economic indicators. At the same time, estimated willingness-to-pay (WTP) for the decrease in local amenities (e.g., crime and noise) is roughly equal to -$1,000 to -$1,600 per household annually (-1.9% to -3.1% of mean household in-come). Overall, we estimate that WTP for allowing fracking equals about $1,300 to $1,900 per household annually (2.5% to 3.7%), although there is substantial heterogeneity across shale regions.
...
Conclusions
Using a new identification strategy based on geological variation in shale deposits within shale plays, we estimate the effects of fracking on local communities. There are four primary findings. First, counties with high fracking potential produce roughly an additional $400 million of oil and natural gas annually three years after the discovery of successful fracking techniques, relative to other counties in the same shale play. Second, these counties experience marked increases in economic activity with gains in total income (4.4 - 6.9 percent), employment (3.6 - 5.4 percent), and salaries (7.6 - 13.0 percent). Further, local governments see substantial increases in revenues (15.5 percent) that are larger than the average increases in expenditures (12.9 percent) though the increased expenditures seem largely aimed at supporting the new economic activity, with little effect, for example, on per pupil expenditures in public schools. Third, there is evidence of deterioration in the quality of life or total amenities, perhaps most notably marginally significant estimates of higher violent crime rates, despite a 20 percent increase in public safety expenditures....