Showing posts with label Ecosystem Valuation. Show all posts

Friday, December 4, 2020

Rebuilding Cities to Generate 117 Million Jobs and $3 Trillion in Business Opportunity with Nature-Positive Strategy

COVID-19 recovery packages that include infrastructure development will influence the relationship between cities, humans and nature for the next 30 to 50 years. With the built environment home to half the world’s population and making up 40% of global GDP, cities are an engine of global growth and crucial to the economic recovery.

Research shows that nature-positive solutions can help cities rebuild in a healthier and more resilient way while creating opportunities for social and economic development. The World Economic Forum’s new Future of Nature and Business Report found that following a nature-positive pathway in the urban environment can create $3 trillion in business opportunity and 117 million jobs.

“Business as usual is no longer sustainable,” said Akanksha Khatri, Head of the Nature Action Agenda at the World Economic Forum. “Biodiversity loss and the broader challenges arising from rapid urban population growth, financing gaps and climate change are signalling that how we build back can be better. The good news is, there are many examples of nature-based solutions that can benefit people and planet.”

Cities are responsible for 75% of global GHG emissions and are a leading cause of land, water and air pollution, which affect human health. Many cities are also poorly planned, lowering national GDP by as much as 5% due to negative impacts such as time loss, wasted fuel and air pollution. However, practical solutions exist that can make living spaces better for economic, human and planetary health.

The study, in collaboration with AlphaBeta, highlighted examples of projects deploying nature-positive solutions and the business opportunities they create.

Cape Town: Cape Town was just 90 days away from turning off its water taps. Natural infrastructure solutions (i.e. restoring the city’s watersheds) were found to generate annual water gains of 50 billion litres a year, equivalent to 18% of the city’s supply needs at 10% of the cost of alternative supply options, including desalination, groundwater exploration and water reuse. 
 
Singapore: Singapore’s water leakage rate of 5% is significantly lower than that of many other major cities thanks to sensors installed in potable water supply lines. Globally, reducing municipal water leakage could save $115 billion by 2030. Returns on investment in water efficiency can be above 20%.
 
Suzhou: Suzhou Industrial Park’s green development in China has seen its GDP increase 260-fold, partially through green development. The park accommodates 25,000 companies, of which 92 are Fortune 500 companies, and is home to 800,000 people. The park has 122 green-development policies, including stipulations on optimizing and intensifying land use, improvement of water and ecological protection, and the construction of green buildings. As a result, 94% of industrial water is reused, 100% of new construction is green, energy is dominantly renewable and green spaces cover 45% of the city.
 
San Francisco: San Francisco requires new buildings to have green roofs. The “green” roof market is expected to be worth $9 billion in 2020 and could grow at around 12% annually through 2030, creating an incremental annual opportunity of $15 billion.
 
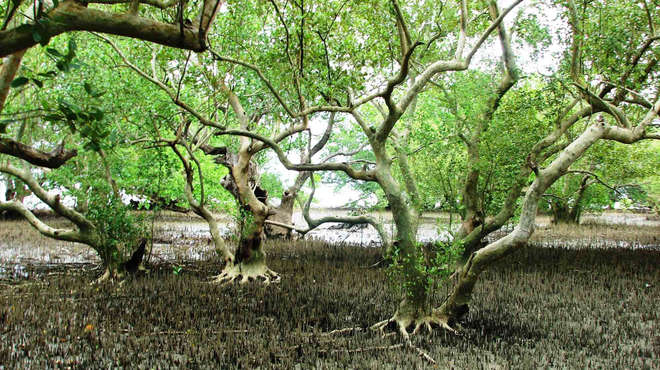
Philippines: The loss of coastal habitats, particularly biodiverse and carbon-rich mangrove forests, has significantly increased the risk from floods and hurricanes for 300 million people living within coastal flood zones. A pilot project in the Philippines, one of the countries most vulnerable to climate change, is monetizing the value of mangroves through the creation of the Restoration Insurance Service Company (RISCO). RISCO selects sites where mangroves provide high flood reduction benefits and models that value. Insurance companies will pay an annual fee for these services, while organizations seeking to meet voluntary or regulatory climate mitigation targets will pay for blue carbon credits. 

Overall, restoring and protecting mangrove forests in human settlements can reduce annual flood damage to global coastal assets by over $82 billion while significantly contributing to fighting climate change.

The report identifies five complementary transitions to create nature-positive built environments and outlines the business opportunities and potential cost savings for programmes targeting urban utilities for water, electricity and waste, land planning and management, sustainable transport infrastructure and the design of buildings.

Office space the size of Switzerland
Global examples call out areas to be improved. For example, an estimated 40 billion square metres of floor space is not used at full occupancy during office hours – an area roughly equivalent to the size of Switzerland. The COVID-19 upheaval has prompted a surge in flexible and remote working models in many countries – greater application of such models could help reduce the need for private office space in the future.

Governments’ role to raise and steer finance
The report calls for both government officials and businesses to play their part in raising and steering finance for sustainable urban infrastructure. “Regulations in areas including urban master planning, zoning and mandatory building codes will be critical to unlocking the potential of net-zero, nature-positive cities and infrastructure,” said Khatri. “We are at a critical juncture for the future of humanity. Now is the time to treat the ecological emergency as just that. A net-zero, nature-positive path is the only option for our economic and planetary survival and how we choose to use COVID-19 recovery packages might be one of our last chances to get this right.”

The Report is available free of charge at:

The Future of Nature and Business sets out how 15 transitions across the three systems can form the blueprint of action for nature-positive transitions which could generate up to US$10.1 trillion in annual business value and create 395 million jobs by 2030.

COVID-19 has brought the Great Acceleration to a screeching halt. Hundreds of thousands of people have died and entire sectors of the economy have stopped operating. All because a novel zoonotic disease, possibly triggered by human disturbance of nature, became a pandemic. As of June 2020, governments and international organizations have invested close to $9 trillion to try to prevent the most immediate human and economic impacts. But despite these efforts, the global economy is expected to contract by 3% in 2020, affecting the jobs and livelihoods of millions of people. page 4
...
A pragmatic framework for the industry to lead the transition towards a nature-positive economy.... can unlock an estimated $10 trillion of business opportunities by transforming the three economic systems that are responsible for almost 80% of nature loss.
...
The first report of the World Economic Forum’s New Nature Economy Report (NNER) series, Nature Risk Rising, highlighted that $44 trillion of economic value generation – over half the world’s total GDP – is potentially at risk as a result of the dependence of business on nature and its services.
...
Key Findings at a Glance

There is no future for business as usual – we are reaching irreversible tipping points for nature and climate, and over half of the global GDP, $44 trillion, is potentially threatened by nature loss.

Fighting climate change is essential but not enough to address the nature crisis – a fundamental transformation is needed across three socio-economic systems: food, land and ocean use; infrastructure and the built environment; and energy and extractives.

80% of threatened and near-threatened species are endangered by the three systems, which are responsible for the most significant business-related pressures to biodiversity; these are also the systems with the largest opportunity to lead in co-creating nature-positive pathways.

15 systemic transitions with annual business opportunities worth $10 trillion that could create 395 million jobs by 2030 have been identified that together can pave the way towards a people- and nature-positive development that will be resilient to future shocks.

Thursday, August 17, 2017

The future value of ecosystem services: Global scenarios and national implications

Highlights
• Global ecosystem services value can differ by $81 trillion/yr by 2050 by scenario.
• Land use change and management underlays our estimates.
• We provide global assessments and details for every country.
• Countries with deserts see the greatest effects.
• The Great Transition scenario can allow a sustainable and desirable future.

Abstract
We estimated the future value of ecosystem services in monetary units for 4 alternative global land use and management scenarios based on the Great Transition Initiative (GTI) scenarios to the year 2050. We used previous estimates of the per biome values of ecosystem services in 2011 as the basis for comparison. We mapped projected land-use for 16 biomes at 1 km2 resolution globally for each scenario. This, combined with differences in land management for each scenario, created estimates of global ecosystem services values that also allowed for examinations of individual countries. Results show that under different scenarios the global value of ecosystem services can decline by $51 trillion/yr or increase by USD $30 trillion/yr. In addition to the global values, we report totals for all countries and maps for a few example countries. Results show that adopting a set of policies similar to those required to achieve the UN Sustainable Development Goals, would greatly enhance ecosystem services, human wellbeing and sustainability.
Image result for earth
NASA
,,,
Putting the land areas and unit values together for each biome, the global total annual flow of ecosystem services values was estimated.... The total global values in both MF and FW were all lower than in 2011, dropping to USD $87.3 and $71.3 trillion/yr, respectively, from a 2011 value of USD $121.6 trillion/yr. The values in PR increased a small amount to USD $122.0 trillion/yr, mostly due to the fact that marine unit values did not change, forest and grassland/rangelands unit values decreased, and wetlands, croplands, and urban unit values increased. In the GT scenario, on the other hand, total global value increased to USD $152.3 trillion/year.
...
The total global annual ecosystem services values when the unit values are unchanged from those used in 2011 and only area extents are changed for each biome. MF and FW decreased to USD $97.0 (11% more than with unit value changes) and $89.1 (25% more than with unit value changes) trillion/yr from 2011 total values, respectively, when only the area was changed, keeping the unit values constant. Total PR values remained the same at USD $122 trillion/yr while GT total values increased to USD $127.0 trillion/yr (17% less than with unit value changes) when unit values were kept at 2011 levels. This comparison shows that using 2011 unit values creates a pattern similar to that when the unit values are changed for each scenario. The only difference is that the change to the total values for each scenario is reduced. This occurs because the changes in unit values amplify the existing changes in area cover of the biomes. Changes in biome areas produce significant changes in global ecosystem service values, regardless of unit values.

The economic value of ecosystem goods and services: The case of Mogale’s Gate Biodiversity Centre, South Africa

Highlights
• The most prominent ecosystem goods and services of MGBC is its contribution to water flow, climate regulation and grazing.
• Using direct market prices, the value of the services are US$1,65 million annually.
• The discounted value, after subtracting the management cost, of the services ranges between US$15,5 and US$41 million.
• The economic value of MGBC is between 25 and 67 times greater than the resource’s published capital value.

Abstract
Natural capital provides various ecosystem goods and services essential to the survival of mankind. In most cases, however, the markets for natural capital are incomplete. As a result, ecosystem goods and services are being enjoyed “freely”. Here we assess the economic value of the ecosystem goods and services of Mogale’s Gate Biodiversity Centre (MGBC) in South Africa using direct market values. We estimate the economic value of the natural capital stocks for game and carbon at approximately ZAR42 million (US$3 million) for 2015. As for the flows of ecosystem goods and services, the economic value was estimated to be approximately ZAR23 million (US$1,65 million) for 2015. Discounting these flow values into perpetuity and subtracting the discounted management cost yields the true economic value of the MGBC, which ranges between at least US$15,5 and US$41 million, depending on the discount rate used. This is between 25 and 67 times greater than the resource’s published capital value. It is this gross underrepresentation of the true value of natural capital that often leads to its destruction. It is strongly recommended that MGBC be represented by its true value in the integrated report of its owner and that it be managed accordingly.
Image result for mogale gate biodiversity centre
http://www.mogalesgate.co.za/
Ecosystem Services via Elsevier Science Direct www.ScienceDirect.com
Volume 26, Part A; August, 2017; Pages 127-136; Available online 29 June 2017.
Shepherd Mudavanhu 1. JamesBlignaut 2. NerineStegmann 4. Garth Barnes 4. Willem Prinsloo 5. Alistair Tuckett 5.
1. Department of Agriculture Economics, University of Stellenbosch, Stellenbosch, South Africa
2. Department of Economics, University of Pretoria, Pretoria, South Africa
3. South African Environmental Observation Network, Pretoria, South Africa
4. Department of Accountancy, University of Johannesburg, Johannesburg, South Africa
5 Mogale’s Gate Biodiversity Centre, Krugersdorp, South Africa
Keywords: Direct market valuation Economic value Ecosystem goods and services Natural capital

Thursday, April 6, 2017

A Global Meta-Analysis of the Value of Ecosystem Services Provided by Lakes

Abstract
This study presents the first meta-analysis on the economic value of ecosystem services delivered by lakes. A worldwide data set of 699 observations drawn from 133 studies combines information reported in primary studies with geospatial data. The meta-analysis explores antagonisms and synergies between ecosystem services. This is the first meta-analysis to incorporate simultaneously external geospatial data and ecosystem service interactions. We first show that it is possible to reliably predict the value of ecosystem services provided by lakes based on their physical and geographic characteristics. Second, we demonstrate that interactions between ecosystem services appear to be significant for explaining lake ecosystem service values. Third, we provide an estimation of the average value of ecosystem services provided by lakes: between 106 and 140 USD$2010 per respondent per year for non-hedonic price studies and between 169 and 403 USD$2010 per property per year for hedonic price studies.
...
Considering the full sample, we find a mean value for lake ecosystem services equal to 315.1 USD$2010 per year (per respondent for NHP studies and per property for HP studies). The median value is 77.6 USD$2010 per year, showing that the distribution of values is skewed with a long tail of high values. On average, the values we find for ecosystem services provided by lakes are higher than the ones reported by Brouwer et al. (1999) for wetlands, 134 USD$2010 per respondent and per year.
...
Fig. 4 presents mean annual lake values per country (in USD$2010 per property per year for studies using an HP approach and in USD$2010 per respondent per year for studies using a NHP valuation method). When considering HP studies, United States rank first with a mean annual value of lakes per property equal to 442.5 USD$2010. The following countries in terms of mean value are New-Zealand, Ireland, Finland, and Canada with 392.2, 310.9, 265.9 and 166.1 USD$2010, respectively. When considering studies using another type of valuation method, Switzerland ranks first with a mean annual value of lakes per respondent equal to 765 USD$2010. The following countries are France, United States and Chile with respectively 644.7, 491.4 and 465 USD$2010 for the mean annual value of lakes per respondent. For countries where lake values are available both with an HP approach and with another valuation approach (i.e. Canada, China, England, Finland, Netherlands, New-Zealand and United States), we observe some significant differences across lake values depending upon the method of valuation. This indicates that the valuation method used in the primary study might have an impact on the estimated value.
Mean annual value of lakes per country and per valuation method.
In Fig. 5, we have split the annual value of a lake according to the presence or not of a specific ecosystem service (and still according to the valuation method used in the primary study). 
Mean annual value of lakes per ecosystem services and per valuation method.
... For NHP studies, the results obtained for different specifications of the basic meta-regression model described in Eq. (1) are presented below:

Six ecosystem services (among the nine specified) appear to be significant namely fishing, swimming, sightseeing, unpecified recreational, maintenance of populations and habitats and spiritual or symbolic appreciation. A particularly high value is found for the spiritual or symbolic appreciation service (+3.6 USD$2010 per year) whereas a low value is documented for the swimming service (+2.1 USD$2010 per year).
...
The different models presented in Tables 2 and 3 allow also to provide some estimates of the average lake value, see Table 4. When considering NHP studies and focusing on models ML3, ML4 and ML5, the average predicted values of a lake in our sample are 106, 120 and 140 USD$2010 per respondent per year. We get higher values when considering HP studies, respectively 169, 193 and 403 USD$2010 per property per year. This suggests that the ecosystem services capitalized in property prices are not equivalent to those valued using NHP approaches. Whatever the type of valuation method considered, our results demonstrate that lakes provide substantial monetary benefits to people....

Tuesday, March 7, 2017

Impact Fees Coupled With Conservation Payments to Sustain Ecosystem Structure: A Conceptual and Numerical Application at the Urban-Rural Fringe

Abstract
Communities in exurban areas increasingly rely on land preservation as a strategy to balance sprawling land development with maintaining environmental amenities. Based on a review of existing approaches for preserving land, we consider a conceptual model of environmental impact fees (EIFs) coupled with conservation payments for managing private land of ecosystem value. In this framework, conservation payments are intended to cost-effectively target fair market value compensation for heterogeneous land for preservation that sustains ecosystem health. EIFs serve as a financial instrument to augment conservation payments and to allow flexibility for landowners with private information to pursue development opportunities while accounting for environmental impacts. Using a bioeconomic model of nature-reserve design, we develop an empirical illustration of how to estimate the EIF of development damage to critical habitat in southern Rhode Island in an effort to preserve land as an environmental infrastructure that maintains ecosystem health.
...
Preserving the entirety of the patches and corridors identified is not necessary to sustain the target level of ecosystem health with the available budget of $3 million. Indeed, the majority of the identified patches and corridors have an optimal ratio < 0.5, suggesting that only a proportion of the patch and corridor needs to be preserved such that some development is allowed on those land parcels.... There are some patches (e.g., patches 69, 84 and 85 with preservation ratios > 0.5) that require not only full preservation of core habitat but also preserved surrounding upland buffer zones.
In this empirical illustration, development damage is measured by the relative percentage loss of the proportion (i.e., the preservation ratio) of each patch or corridor that needs to be preserved for the conservation program to cost-effectively achieve its goal within the allocated budget. For example, patch 67 has an optimal preservation ratio prescribed at 0.48, which indicates 48% of the identified patch needs to be preserved. For this patch, a 10% development damage is modeled as a 10% reduction (due to development) in its preservation ratio such that only around 43% of the patch is available at most for preservation although a 48% preservation is optimal (cost-effective). Similarly, 100% development damage refers to the complete loss of the portion (48%) of the patch required to be preserved for the target level of ecosystem health.

... The estimated EIFs exhibit two characteristics that deserve mentioning.... For the same level of development damage, the EIF varies across the patches. This result can be attributed to the heterogeneity of individual land parcels in sustaining ecosystem health relative to their costs, their role in the ecosystem health function Q, and the costs and role of the replacement land. A low EIF implies that the related patch is less critical to maintaining the target level of ecosystem health with the available budget, and it is relatively easier to compensate the damage by minor adjustments in the conservation program without incurring a significant cost increase. In contrast, a high impact fee indicates an ecologically valuable patch such that any development damage would require expensive adjustment in the conservation program, including acquiring more expensive land to enhance other identified patches and corridors available for preservation or to target new patches and corridors....

As expected, EIFs can increase quickly with the extent of development damage to patches and corridors. Table 1 shows that for a 10% development damage, the estimated EIF on a per acre basis ranges from $11.03 for patch 176 to $400.07 for patch 71; in contrast, when the development damage reaches 100%, the majority of the estimated EIFs are on the order of $10,000 per acre with the highest at over $82,000 per acre for patch 85. This result implies that: 1) conservation cost increases non-linearly, at a rising rate with development damage, suggesting it is relatively cheaper and easier to establish a conservation reserve in the early stage of community development, and 2) minor development damage could be mitigated at low costs and it can be very expensive to compensate severe development damage to land of ecosystem value. Note that extremely high EIFs seem likely to prevent complete development to the corresponding patches and corridors of critical ecosystem value and yet these high EIFs remain near or below typical market (tax) value of buildable lots in the study area.

http://www.sciencedirect.com/science/article/pii/S0921800916306644
by Yong Jiang 1 and 2 and Stephen K. Swallow 3 
1. UNESCO-IHE Institute for Water Education, Westvest 7, 2611AX Delft, The Netherlands
2. Department of Public Management, Faculty of Humanities and Social Sciences, Dalian University of Technology, Dalian 116024, China
3. Department of Agricultural and Resource Economics and Center for Environmental Sciences and Engineering, University of Connecticut, Storrs, CT 06269, USA
Ecological Economics via Elsevier Science Direct www.ScienceDirect.com
Volume 136; June, 2017; Available online 23 February 2017; Pages 136–147
Under a Creative Commons license,  Open Access
Keywords: Land use regulation; Land preservation; Impact fees; Ecosystems; Public finance; Urban sprawl; Wetlands; Development rights; Spatial; Metapopulation

Understanding the distribution of economic benefits from improving coastal and marine ecosystems

Highlights
• Estimates of welfare benefits from better environmental quality of the coastal and marine waters of Latvia are provided.
• Variation in the benefits related to differences in their socio-demographics is identified.
• A novel approach to account for differences in individuals' preferences using their characteristics is proposed.
• Latvians are willing to pay for protecting biodiversity, and reducing eutrophication, and occurrences of invasive species.
• We observe substantial heterogeneity in values placed on water quality improvements.

Abstract
The ecological status of coastal and marine waterbodies world-wide is threatened by multiple stressors, including nutrient inputs from various sources and increasing occurrences of invasive alien species. These stressors impact the environmental quality of the Baltic Sea. Each Baltic Sea country contributes to the stressors and, at the same time, is affected by their negative impacts on water quality. Knowledge about benefits from improvements in coastal and marine waters is key to assessing public support for policies aimed at achieving such changes. We propose a new approach to account for variability in benefits related to differences in socio-demographics of respondents, by using a structural model of discrete choice. Our method allows to incorporate a wide range of socio-demographics as explanatory variables in conditional multinomial logit models without the risk of collinearity; the model is estimated jointly and hence more statistically efficient than the alternative, typically used approaches. We apply this new technique to a study of the preferences of Latvian citizens towards improvements of the coastal and marine environment quality. We find that overall, Latvians are willing to pay for reducing losses of biodiversity, for improving water quality for recreation by reduced eutrophication, and for reducing new occurrences of invasive alien species. However a significant group within the sample seems not to value environmental improvements in the Baltic Sea, and, thus, is unwilling to support costly measures for achieving such improvements. The structural model of discrete choice reveals substantial heterogeneity among Latvians towards changes in the quality of coastal and marine waters of Latvia.

The full paper is currently available free of charge at:
...
When marginal WTPs for the attributes are compared across the individuals, we find that the means of WTP for avoiding reductions of native species range from LVL [Latvian Lats currently 1 = 1.61 dollars] 0.73 to LVL 2.43, and the values do not differ significantly as indicated by the overlapping confidence intervals (we do not distinguish between the levels of the attribute because the means do not differ significantly). Better water quality for recreation is the improvement which everyone, except for the pensioner, wants to see implemented. We observe some differences across the positive WTPs for this improvement between the individuals. For example, the single mother is willing to pay statistically significantly more than the family head for having water quality for recreation improved to a moderate state; the student is willing to pay statistically significantly more than the businessman for having water quality for recreation improved to a good state. The student, the family head, and the businessman are the only who would pay for limiting new occurrences of invasive alien species. Regardless of the attribute level, the mean WTPs range from LVL 1.15 to LVL 3.23, and they do not differ significantly from each other as shown by the confidence intervals
by Kristine Pakalniete 1, Juris Aigars 2, Mikołaj Czajkowski 3, Solvita Strake 4, Ewa Zawojska 3, Nick Hanley 5
1. AKTiiVS Ltd., Latvia
2. Latvian Institute of Aquatic Ecology, Latvia
3. University of Warsaw, Department of Economics, Poland
4. Latvian Institute of Aquatic Ecology, Latvia
5. University of St Andrews, Department of Geography and Sustainable Development, UK
Science of The Total Environment via Elsevier Science Direct www.ScienceDirect.com
Volumes 584–585; 15 April 2017; Available online 27 January 2017; Pages 29–40
Keywords: Coastal and marine water quality; Biodiversity; Invasive alien species; Eutrophication; Discrete choice experiment; Observed preference heterogeneity; Socio-demographic characteristics; Hybrid choice model

Sunday, March 5, 2017

Comprehensive Wealth in Canada - Measuring what matters in the long run

Comprehensive wealth focuses on the role of people, the environment and the economy in creating and sustaining well-being. Complementing indicators like gross domestic product (GDP) and addressing issues the can’t capture on their own, comprehensive wealth measures are key to successfully guiding Canada through the 21st century and beyond.

This study reviewed Canada’s comprehensive wealth performance over the 33-year period from 1980 to 2013. This timeframe extends well beyond business and political cycles, ensuring that the results reveal trends free from the ebb and flow of markets and policies. The report found that comprehensive wealth grew slowly in Canada between 1980 and 2013 (0.19 per cent annually in real per capita terms). This was in contrast to relatively robust growth in real per capita consumption of goods and services (1.36 per cent annually). The divergence between these two trends points to potential concerns for long-term well-being.

In terms of the components of comprehensive wealth:
  • Produced capital was the bright spot, growing by 1.68% annually from 1980 to 2013, though most (70%) of this growth was concentrated in the oil and gas extraction industry and housing
  • Market natural capital (fossil fuels, timber, minerals and farmland) declined by 0.93% annually (for a total drop of 25%)
  • Non-market natural capital (ecosystems and climate) declined based on a set of non-monetary indicators
  • Human capital, which accounts for about 80% of Canada’s comprehensive wealth, did not grow at all, meaning that average lifetime earnings prospects in 2013 were no better than in 1980
  • Social capital appears to have been stable based on a suite of non-monetary indicators.
Comprehensive Wealth rose 7%, or .19% per year from $592000 in 1980 to $631,000 in 2013 as Market Natural Capital fell from $39,800 to $29,200 per person.


Green Growth Knowledge Platform http://www.greengrowthknowledge.org
Source: International Institute for Sustainable Development (IISD)
December, 2016

Sunday, January 15, 2017

Governance and implementation challenges for mangrove forest Payments for Ecosystem Services (PES): Empirical evidence from the Philippines

Highlights
• Economic, social, and governance challenges for mangrove PES are investigated.
• The research uses primary data from two coastal sites in the Philippines.
• Mangrove carbon PES could contribute an additional 2.3–5.8% to current village income.
• Payments could finance ventures that counteract the environmental benefits of schemes.
• PES may require multi-level and multi-actor governance with local participation.

Abstract
Mangrove forests have been considered as potentially suitable for PES, though few mangrove PES schemes exist worldwide, suggesting they - and the broader social-ecological and governance systems in which they sit - may not be as conducive to PES as first thought. This study assesses economic, social, and governance challenges to implementing PES in mangroves. It draws on empirical evidence from two prospective community-level mangrove carbon PES schemes in the Philippines, where fishing and aquaculture are major livelihoods. We conducted (1) policy reviews and interviews with local communities, government, and NGOs to investigate governability; (2) village income accounting to determine the extra income that participants could receive through PES; and (3) a choice ranking exercise to elicit preferences on how payments could best be spent to enhance participant wellbeing. The latter approach identifies key gender differences, and enables potential PES-induced social-ecological trade-offs to be pre-empted. Blue carbon PES can contribute an additional 2.3–5.8% of current village incomes, while villagers would prefer to spend the monies on more effective fishing equipment, which could perversely jeopardize fishery sustainability. To be most successful, coastal PES schemes in the Philippines need to be managed through a multi-level governance regime involving co-management and local participation.
Mangrove forest at low tide, Philippines
by Benjamin S. Thompson 1, , , Jurgenne H. Primaver 1 and 2, Daniel A. Friess 1
1. Department of Geography, National University of Singapore, 1 Arts Link, Singapore 117570, Singapore
2. Community-Based Mangrove Rehabilitation Project, Zoological Society of London, 132 Quezon St., Iloilo City, Philippines
Ecosystem Services http://www.sciencedirect.com/science/journal/22120416 via Elsevier Science Direct www.ScienceDirect.com
Volume 23, February 2017, Available online 28 December 2016; Pages 146–155

Keywords: Benefit sharing; Blue carbon; Conservation; Gender; Perverse incentives; Fishers

Friday, January 13, 2017

Physical and monetary ecosystem service accounts for Europe: A case study for in-stream nitrogen retention

Highlights
• We present a case study of ecosystem accounting based on the SEEA-EEA framework.
• Accounts for water purification are developed in physical and monetary terms.
• Flow accounts include both actual and sustainable flows.
• Capacity is assessed as Net Present Value of the sustainable flow.
• Replacement cost is the exchange value technique used for the monetary valuation.

Abstract
In this paper we present a case study of integrated ecosystem and economic accounting based on the System of Environmental Economic Accounting — Experimental Ecosystem Accounts (SEEA-EEA). We develop accounts, in physical and monetary terms, for the water purification ecosystem service in Europe over a 20-year time period (1985–2005). The estimation of nitrogen retention is based on the GREEN biophysical model, within which we impose a sustainability threshold to obtain the physical indicators of capacity – the ability of an ecosystem to sustainably supply ecosystem services. Key messages of our paper pertain the notion of capacity, operationalized in accounting terms with reference to individual ecosystem services rather than to the ecosystem as a whole, and intended as the stock that provides the sustainable flow of the service. The study clarifies the difference between sustainable flow and actual flow of the service, which should be calculated jointly so as to enable an assessment of the sustainability of current use of ecosystem services. Finally, by distinguishing the notion of ‘process’ (referred to the ecosystem) from that of ‘capacity’ (pertaining specific services) and proposing a methodology to calculate capacity and flow, we suggest an implementable way to operationalize the SEEA-EEA accounts.

...
We calculate that replacing this ecosystem service capacity would require approximately one million ha of constructed wetland, representing a net present value of between 310 billion € in 1990 and 459 billion € for the year 2005.
...
Monetary flows by country follow:
A river flowing into a lake surrounded by green rushes
by Alessandra La Notte 1, Joachim Maes 1, Silvana Dalmazzone 2, Neville D. Crossman 3, Bruna Grizzetti 1, Giovanni Bidoglio 1
1. European Commission - Joint Research Centre, Directorate D – Sustainable Resources, Via Enrico Fermi 2749, 21027 Ispra, VA, Italy
2. Department of Economics and Statistics, University of Torino, Campus Luigi Einaudi, Lungo dora Siena 100, 10153 Torino, Italy
3. CSIRO Land and Water Flagship, Waite Campus, 5064 Adelaide, South Australia, Australia
Ecosystem Services via Elsevier Science Direct www.ScienceDirect.com
Volume 23, February 2017, Pages 18–29
Keywords: Ecosystem accounting; Ecosystem services; Water purification; Capacity; Sustainable flow; Actual flow

Thursday, January 12, 2017

Evaluating services and damage costs of degradation of a major lake ecosystem

Highlights
• Ecosystem services of lakes are commonly ignored and likely underestimated.
• We develop a systematic approach to assess the value of lake ecosystem services.
• We also assess potential damage costs associated with eutrophication.
• Our study shows lakes as an important economic asset, justifying restoration and conservation.

Abstract
Values of ecosystems and potential losses associated with their degradation are complex and often ignored in economic assessments. The concept of ecosystem services may describe these values, as it is widely used to communicate the benefits that humans derive from ecosystems. The aim of this study was to conduct a valuation of a lake ecosystem and potential damage costs arising from its degradation. The approach was applied to Lake Rotorua (central North Island, New Zealand). The range of values derived from ecosystem services provided by Lake Rotorua was calculated using selected indicators and direct market pricing, indirect pricing (hedonic pricing, replacement cost) and existence value pricing. Social damage costs were calculated from loss of income from impaired recreation and reduced property values, as well as ecological damage costs caused by algal blooms and decline in habitat quality for aquatic fauna. The values of ecosystem services provided by Lake Rotorua in 2012 were calculated to be NZD 94-138 million p.a., with potential damage costs of eutrophication calculated at $14-48 million p.a. These estimates indicate that lakes are an important economic asset, and continuous ecosystem degradation has an external cost that is commonly ignored in management decisions.
Lake Rotorua.jpg
by Hannah Mueller 1, David P. Hamilton 1 and Graeme J. Doole 2
1. Environmental Research Institute, University of Waikato, Private Bag 3105, Hamilton 3240, New Zealand
2. Waikato Management School, University of Waikato, Private Bag 3105, Hamilton 3240, New Zealand
Ecosystem Services http://www.sciencedirect.com/science/journal/22120416 via Elsevier Science Direct www.ScienceDirect.com
Volume 22, Part B, December 2016, Pages 370–380
Special Issue: Integrated valuation of ecosystem services: challenges and solutions
Keywords: Ecosystem services; Valuation; Ecological damage costs; Eutrophication; Lake restoration; Conservation benefits

Tuesday, January 10, 2017

Synergies between biodiversity conservation and ecosystem service provision: Lessons on integrated ecosystem service valuation from a Himalayan protected area, Nepal

Highlights
• TESSA was used for integrated ecosystem services valuation of Shivapuri-Nagarjun National Park, Nepal.
• Net monetary ecosystem service value of protecting the Park was estimated at $11 million y-1.
• Protection avoided a reduction in carbon stock of 60% and a net annual monetary loss of 19%.
• Conservation and ecosystem service provision objectives were congruent at site-level.
• A buffer zone around the park may improve benefit sharing.

Abstract
We utilised a practical approach to integrated ecosystem service valuation to inform decision-making at Shivapuri-Nagarjun National Park in Nepal. The Toolkit for Ecosystem Service Site-based Assessment (TESSA) was used to compare ecosystem services between two alternative states of the site (protection or lack of protection with consequent changed land use) to estimate the net consequences of protection. We estimated that lack of protection would have substantially reduced the annual ecosystem service flow, including a 74% reduction in the value of greenhouse gas sequestration, 60% reduction in carbon storage, 94% reduction in nature-based recreation, and 88% reduction in water quality. The net monetary benefit of the park was estimated at $11 million year-1. We conclude that: (1) simplified cost-benefit analysis between alternative states can be usefully employed to determine the ecosystem service consequences of land-use change, but monetary benefits should be subject to additional sensitivity analysis; (2) both biophysical indicators and monetary values can be standardised using rose plots, to illustrate the magnitude of synergies and trade-offs among the services; and (3) continued biodiversity protection measures can preserve carbon stock, although the benefit of doing so remains virtual unless an effective governance option is established to realise the monetary values.

Examining the ecosystem service of nutrient removal in a coastal watershed

Highlights
...
• The Piscataqua-Salmon Falls watershed community needs to address wastewater treatment plants.
• Conservation could reduce 3–28 t/yr of Nitrogen, worth 10–50 million dollars over ten years.
• Even under high conservation removal estimates of 28.1 ton/yr, point source reductions are needed.

Abstract
Globally, managers are trying to prevent or halt the eutrophication of valuable estuaries and bays by reducing nutrient inputs, but justifying the cost of conservation or processing facility upgrades often proves challenging. We focus on a coastal watershed in Maine and New Hampshire struggling with the financial burdens of nitrogen pollution mandates due to the eutrophication of the Great Bay estuary. After creating two future watershed land cover scenarios comparing plausible extremes, we ran them through two models, the Natural Capital Project’s InVEST (Integrated Valuation of Ecosystem Services and Tradeoffs) and a detailed hydrologic and biogeochemical river network model FrAMES (Framework for Aquatic Modeling of the Earth System). Through this work, we both evaluated and valued the ecosystem service of nitrogen retention. We find that both models provide numerical arguments for conservation efforts, and decision makers would benefit from using either an ecosystem services model or a biogeochemical model when dealing with complex issues like nutrient overenrichment. According to both our modeling results, modest watershed conservation efforts as defined by our expert stakeholders, ie: protecting wetlands and forests, could reduce the amount of total nitrogen entering the Great Bay estuary in the range of 3–28 metric tons per year.
aerial shot of Little Bay and Great Bay
by Chelsea E. Berg 1, Madeleine M. Mineau 2 and Shannon H. Rogers 1 
1. Center for the Environment, Plymouth State University, United States MSC 63 17 High Street, Plymouth, NH 03264, United States.
2. Earth Systems Research Center, University of New Hampshire, Durham, NH, USA
Ecosystem Services http://www.sciencedirect.com/science/journal/22120416 via Elsevier Science Direct www.ScienceDirect.com
Volume 22, Part B, December 2016, Available online 24 December 2016; Pages 309–317
Special Issue: Integrated valuation of ecosystem services: challenges and solutions
Keywords: Ecosystem service valuation; Nutrient retention; InVEST; Great Bay; Avoided cost analysis; FrAMES

Estimating the value of ecosystem services in a mixed-use watershed: A choice experiment approach

Highlights
• Location and costs are significant explanatory variables of MWTP.
• Annual household income was associated with ecosystem services preferences.
• The average MWTP for ecosystem services was extremely low (<$2/household/year)
• A dissociation between local needs and global issues explains the overall low valuations.
Abstract
The protection of water, land, and air resources has profound implications for the sustainability of ecosystem services provided to societies that are embedded within economies, global systems, and socio-cultural and political contexts. This study assessed preferences for provisioning, regulating, and supporting ecosystem services, specifically, climate regulation (carbon sequestration), nutrient control (water quality), and agricultural and forest productivity, and the willingness to pay for protection of these ecosystem services by residents in the Suwannee River Basin of Florida, as assessed through a household mail survey and choice experiment. A conditional logit model was used to evaluate preferences and marginal willingness to pay (MWTP) under different scenarios. Survey respondents identified nutrient control (water quality) as the most important service, while agricultural and forestry production was somewhat important, and climate regulation/carbon sequestration was the least important. Respondents expressed the highest level of trust in local government agencies to implement ecosystem service protection programs, and welcomed the implementation of such programs anywhere in the basin, but not close to their home. The average MWTP was extremely low (<$2/household/year) when compared to other studies, and suggests that respondents have many competing interests for their discretionary spending in relation to environmental amenities.
Suwannee River.jpg
Pasicha Chaikaew 1 and 3, Alan W. Hodges 2 and Sabine Grunwald 3 
1. Department of Environmental Science, Chulalongkorn University, Bangkok 10330, Thailand
2. Department of Food and Resource Economics, University of Florida, Gainesville, FL 32611, USA
3. Department of Soil and Water Science, University of Florida, Gainesville, FL 32611, USA
Ecosystem Services via Elsevier Science Direct www.ScienceDirect.com
Volume 23; February, 2017; Pages 228–237
Keywords: Ecosystem services; Choice experiments; Willingness to pay; Preferences

Sunday, January 8, 2017

Recreational Value of Coastal and Marine Ecosystems in India: A Partial Estimate

Abstract
Recreation is an important ecosystem service in coastal and marine ecosystems. The methodology for valuing recreational services is well developed in the literature. To the best of our knowledge, this is the first attempt at estimating a country-wide value for this service. Using the zonal travel cost method we estimate the partial value of this service to be Rs 531.7 billion in 2012-13 for domestic tourists when consumer’s surplus component is not added. Therefore, this represents a floor value. This constituted about 0.49% of the GDP (at current prices in that year). It is expected that the final value of these services will be higher than what this estimate suggests as it constitutes only what the consumers (recreational visitors) spent in their travel by way of cost of travel, accommodation and income forgone (opportunity cost). The main purpose of this exercise is to understand how these ecosystems services are valued by individuals as there is no direct way to recognize their value. It then helps us to allocate resources better and conserve natural capital.

by Pranab Mukhopadhyay and Vanessa da Costa; both of Department of Economics, Goa University, Goa and Visiting Scholars, Madras School of Economics) (pm@unigoa.ac.in)
Madras School of Economics
Working Paper 124/2015; September, 2015
via REPEC Research Papers in Economics www.REPEC.org

Sunday, November 13, 2016

Valuing hypothetical wildfire impacts with a Kuhn–Tucker model of recreation demand

Abstract
This study uses a nonmarket valuation method to investigate the recreation values of the San Jacinto Wilderness in southern California. The analysis utilizes survey data from a stated-choice experiment involving backcountry visitors who responded to questions about hypothetical wildfire burn scenarios. Benefits of landscape preservation are derived using a Kuhn–Tucker (KT) demand system. Model results suggest that recreationists are attracted to sites with recent wildfires that can be viewed up-close. For example, recreational welfare estimates increased for sites that were partially affected by different types of wildfires, with the greatest gains being observed for the most recent wildfires. Per person mean seasonal willingness-to-pay varied from a low of $10 to a high of $48, for total gains ranging from $62,223 to $635,286. However, wildfires that cause trail closures create welfare losses. Seasonal losses per person for complete closure of particular sites range from $3 to $221, for total losses ranging from $29,600 to $2.9 million.
File:Wildfire in California.jpg
Highlights
• Analysis uses survey data from a stated-choice experiment involving backcountry visitors.
• Recreationists are attracted to sites with recent low intensity wildfires that can be viewed up-close.
• Recreational welfare estimates increased for sites that were partially affected by different types of wildfires.
• Wildfires that cause trail closures create welfare losses.

http://www.sciencedirect.com/science/article/pii/S1389934115300319
by José J. Sánchez 1, Ken Baerenklau 2, Armando González-Cabán 1
1. USDA Forest Service, Pacific Southwest Research Station, 4955 Canyon Crest Drive, Riverside, CA 92507, USA
2. University of California, Riverside, Riverside, CA 92521, USA
Forest Policy and Economics http://www.sciencedirect.com/science/journal/13899341 via Elsevier Science Direct www.ScienceDirect.com
Volume 71, October 2016, Pages 63–70;
Keywords: Kuhn–Tucker demand system model; Forest recreation value; Hypothetical burn scenarios; Web-based survey; Nonmarket valuation
☆ This article is part of a special issue entitled “Integrating ecosystem service concepts into valuation and management decisions" published in Forest Policy and Economics 71, 2016.

Sunday, October 30, 2016

Willingness to pay for ecosystem conservation in Alaska’s Tongass National Forest: a choice modeling study

Abstract:
Forest ecosystems contribute to human welfare in important ways, but because of the nonmarket nature of many of the goods and services produced, both markets and governments fail to optimize their production commensurate with their economic and ecological significance. Despite the recent proliferation of nonmarket environmental valuation in the literature, the incorporation of nonmarket values into public forest decision making has been limited by institutional and methodological barriers. To address this disconnect, we conducted a case study to quantify conservation values for the Tongass National Forest in a manner conducive for public forest planning. A choice experiment featuring proposed forest management alternatives with changes in critical attributes relative to their levels in the status quo was used to generate the requisite data. Econometric analysis suggests that Alaskans have strong preference for conservation management, including both preservation and ecological restoration, over status quo or exploitation management. However, there is significant heterogeneity among Alaskans in terms of bias toward the status quo depending on their socioeconomic characteristics, e.g., gender, age, place of residence, household income, whether or not they have dependent children. The findings of this study can be helpful to forest managers in the preparation of resource management plans consistent with maximization of total economic value of forest ecosystem services.
...
Discussion and Conclusions
The objective of this study was to use best practices for designing a choice experiment most applicable for forest planning and management to measure WTP for conservation programs on the Tongass. The mean WTP for 50% old-growth preservation (US$147 2012) is consistent with the mean preservation values found in a meta-analysis (Hjerpe et al. 2015) of global ecosystem conservation (US$131 2010). Estimation results based on random parameter logit show that household WTP varies depending on the attribute and specific level. However, there are important differences in how respondents value different levels of each attribute. In particular, the scope effect seems to hold for old-growth preservation and watershed restoration attributes (with the 100% level preferred more than 50% level), but does not for the second-growth forest restoration attribute. For this attribute the coefficient on 100% is much smaller than the corresponding coefficient on 50% level. This valuation pattern suggests that Alaskans hold significant values for nontimber outputs because the background information provided to them on old growth preservation explicitly stated that the benefits would be of nontimber type and would entail the loss of timbering jobs on these acres. Yet, the smaller program WTP for a 100% increase in all noncost attributes compared with a 50% means that Alaskans’ support for conservation has a threshold and is diminished past a certain point....
View overlooking green trees and water
by Evan E. Hjerpe 1 and Anwar Hussain 1 and2
1. Conservation Economics Institute
2. Forest Policy Center, Auburn University
Ecology and Society www.ecologyandsociety.org
Volume 21, Number 2; 2016; Article 8

Friday, July 8, 2016

Cash for Carbon: A Randomized Controlled Trial of Payments for Ecosystem Services to Reduce Deforestation

Abstract:
This paper evaluates a Payments for Ecosystem Services (PES) program in western Uganda that offered forest-owning households cash payments if they conserved their forest. The program was implemented as a randomized trial in 121 villages, 60 of which received the program for two years. The PES program reduced deforestation and forest degradation: Tree cover, measured using high-resolution satellite imagery, declined by 2% to 5% in treatment villages compared to 7% to 10% in control villages during the study period. We find no evidence of shifting of tree-cutting to nearby land. We then use the estimated effect size and the "social cost of carbon" to value the delayed carbon dioxide emissions, and compare this benefit to the program's cost. 
...
Addressing deforestation in developing countries is, thus, a key pillar of international climate policy. REDD+ (Reducing Emissions from Deforestation and Forest Degradation) is a United Nations mechanism through which developing countries are rewarded financially for preservation of forestland; annually, about $500 million dollars flow to developing countries (Silva-Ch´avez, Schaap, and Breitfeller, 2015). The Paris Agreement negotiated in 2015 bolstered the role of REDD+ in climate policy (United Nations FCCC, 2015).
...
Over the two-year pilot program from 2011 to 2013, for each hectare of forest they owned, enrollees received 70,000 Ugandan shillings (UGX), or $28 in 2012 US dollars, per year if they complied with the contract. The implementing NGO employed forest monitors who conducted spot checks of enrollees’ land to check for recent tree-clearing. The program also offered additional payments in exchange for planting tree seedlings.
...
File:Kibale, Uganda.jpg
We estimate that for each $0.25 in payments, or $0.57 in total program costs, a ton of CO2 emissions due to deforestation was delayed. We then calculate the externality benefit of the delayed emissions, using a “social cost of carbon” (SCC) of $39 (in 2012 US dollars) per ton (Interagency Working Group on Social Cost of Carbon, 2013). The SCC is the benefit of permanently averting CO2 emissions, while this 2-year program’s benefit was to delay deforestation and emissions. To quantify the delay, we need to make assumptions about deforestation after the program ends, which we do not observe in our data. Our base case scenario assumes PFOs deforest at a 50% higher rate than usual after the program ends, converging to the control group after four years. The social benefit of the delayed CO2 emissions is then $1.11 per ton, or roughly 2 times the $0.57 program cost.

We repeat the calculation for a range of assumptions. At one extreme, if PFOs catch up on their backlog of avoided deforestation the moment the program ends, the benefitcost ratio falls to 0.7. At the other extreme, if PFOs pause their deforestation during the intervention and then resume deforesting at their typical rate, not an accelerated rate, after the program ends, then the benefit cost-ratio rises to 12.3. This last scenario, which represents a permanent delay in deforestation, is the most relevant one for extrapolating to a permanent or longer-duration program.
 
...
On average, revenue from timber products in the previous year is 110,000 UGX or $44....per PFO who enrolled, the average payment was $113 ($36 ÷ 31.9%)... in the treatment group, total revenue from timber products is lower by 2.89 million UGX ($116), or 23 log points, and there is a 4 percentage point (27%) lower likelihood of receiving any revenue from timber in the past year.
...
Monitoring costs were $88 per program enrollee, or $28 per eligible PFO. We assume an additional cost per eligible PFO of $30 for marketing of the program and overall program management. We further assume a 10%
transaction fee for PES payments. Combining these assumptions, the administrative costs amount to $0.41 per averted ton of CO2
...our best guess of the total program costs at scale-up—incentive payments plus administrative costs—is $0.57 per averted ton of CO2

  
by Seema Jayachandran, Joost de Laat, Eric F. Lambin, Charlotte Y. Stanton
National Bureau of Economic Research (NBER)
NBER Working Paper No. 22378; Issued in June 2016


via/hat tip Chris Mooney http://tinyurl.com/zg4bd9c