Monday, March 25, 2013

The Long-term Effects of Early Lead Exposure: Evidence from a case of Environmental Negligence

Abstract: 
This paper estimates the effect of early lead exposure on academic achievement and adult earnings. We analyze longitudinal information from individuals attending primary and secondary schools in the city of Arica (in northern Chile). Between 1984 and 1989, Arica received more than 20,000 tons of toxic chemicals containing high concentrations of lead. Initially, the chemical waste was located several kilometers from the city. However, Arica's rapid expansion, which included the construction of housing projects just meters away from the waste deposit, put a large number of families at risk. Our data include information on residential proximity to the polluted area, levels of lead exposure, comprehensive demographic information, nationally representative academic test scores and administrative data on adult earnings.

We document a strong relationship between blood lead levels and student academic performance. We find that an increase of one microgram of lead per deciliter of blood reduces math and language scores by 0.15 and 0.21 standard deviations, respectively. For earnings, we estimate that for each extra microgram of lead, monthly earnings decrease by CLP 11,458 (or USD 22.92). This translates into a reduction of USD 6,000 in lifetime earnings per microgram of lead per deciliter of blood.
House near original dump site
A home in Arica, Chile, near the original dump site.

by Tomás Rau, Loreto Reyes, Sergio S. Urzúa National Bureau of Economic Research (NBER) www.NBER.org
NBER Working Paper No. 18915; Issued in March 2013

Flooding and Liquidity on the Bayou: The Capitalization of Flood Risk into House Value and Ease-of-Sale

http://onlinelibrary.wiley.com/doi/10.1111/j.1540-6229.2012.00338.x
Abstract:
The existing literature focuses on how perceived flood risk affects house value. Search theory, however, implies that flood risks will be capitalized into both house price and liquidity. This article draws on search theory to develop an empirical approach for estimating flood risk capitalization into both price and selling time. The results show the mix of price and liquidity capitalization varies by level of flood risk as well as across housing market phases. Regardless of the specific capitalization pattern, the results illustrate that focusing solely on price without allowing for concomitant liquidity capitalization can yield estimates that understate the full impact of flood risk on house transactions.
...
All of the base model estimates exhibit the expected signs and the estimates for the base model variables are robust across the extended models. Following Kennedy (1981), the coefficient estimates imply that houses in the Highest Risk Zone exhibit significant price discounts of about 2.8% and longer expected selling times. The price discount is consistent with the bulk of the existing empirical literature (except Morgan (2007)) concluding that flood risk reduces property value. Nonetheless, the estimates reported here clearly illustrate that focusing solely on price capitalization understates the full impact of being in a higher flood risk zone, as it overlooks the significantly greater difficulty of selling property so situated. In any case, the estimates are consistent with the notion that if flood insurance benefits are underpriced, they are not sufficiently underpriced to fully compensate for the perceived costs of flooding in the highest risk areas of Baton Rouge.

IBM Taps Big Data to Help Solve Water Challenges Across South Africa“WaterWatchers,” a new mobile app, harnesses the power of crowdsourcing

IBM (NYSE: IBM) marks World Water Day with the launch of a crowdsoucing project to help capture, share and analyze information about the water distribution system in South Africa. The project, called “WaterWatchers,” is driven by a new mobile phone application and SMS capability that will enable South African citizens to report water leaks, faulty water pipes and general conditions of water canals. Every update will provide vital data points to an aggregated “WaterWatchers” report to create a single view of the issues challenging South Africa’s water distribution system.

IBM's new WaterWatchers app helps citizens contribute to the health of their local water supply
The free app, currently available for Android download at www.ibmwaterwatchers.co.za, and the SMS capability* together provide an easy way for anyone to collect and report issues on local waterways and pipes to a centralized portal. After taking a photo and answering three simple questions about the particular water canal or pipe, the data is uploaded in real-time to a central database. After 30 days, the data will be analyzed and aggregated into a meaningful “leak hot spot” map for South Africa.
...
IBM began exploring crowdsourcing to address water related issues in the city of San Jose, California, with its CreekWatch mobile app, which is still available and currently being used in more than 25 countries. WaterWatchers was adapted from the CreekWatch concept to include additional capabilities such as SMS and the ability to share photos on social networks such as Facebook and Twitter.

... South Africa has seen the department of water affairs increase spending by 20% to R9 billion ($900M USD) in 2011- 2012. Similarly, spending on water sector management has increased by 28.8% year on year over the same period and spending on water infrastructure management has risen by 13.2% year on year. But the pressure of urban population influx continues to place more strain on ageing water infrastructure. According to the 2011 Census, ninety-three percent of South African households had access to safe water in 2010 but only 45% of those with access to water actually had it in their homes.

A WaterWatchers report will be made available to local municipalities, water control boards and other water system stakeholders once the data is filtered appropriately.  This could help local municipalities vizualise and prioritize improvements to city water infrastructure.

The WaterWatchers platform holds enormous potential for similar applications that can be used to monitor and report on just about any aspect of one’s environment: city services (report potholes, late buses), wildlife, noise pollution, air quality, weather and more.
...
For more information about IBM Smarter Water, visit www.ibm.com/smarterplanet/water

The IBM Smart Water site offers an October 15, 2012 white paper from the IBM Institute for Business Value by Mary Keeling and Michael Sullivan and available free of charge at http://www.smartgridnews.com/artman/uploads/1/IBM_Smarter_Water_Management_White_Paper_1.pdf entitled "Fixing the future: Why we need smarter water management for the world’s most essential resource" which  highlights the vulnerability of the world's water system and outlines why cities, utilities and businesses "must take immediate action to deploy a smarter approach to water management to solve the world’s water crisis."  This white paper highlights the vulnerability of the world's water system and outlines why cities, utilities and businesses "must take immediate action to deploy a smarter approach to water management to solve the world’s water crisis."

The report notes that according to the Organisation for Economic Co-operation and Development (OECD), US$68 billion of the $121 billion of economic activity generated by the water industry is provided as inputs to other activities. This underestimates the true value and importance of water in supporting economic activity as the price paid by users for water in many countries does not reflect the true cost of supply. Water is needed to produce a host of goods and services.

An alarming percentage of the world’s water is going to waste. For example, nearly 35 percent of all the water used each year in agriculture is frivoled away by poor resource management. according to “The world’s 4 trillion dollar challenge: Using a system-of-systems approach to build a smarter planet.” by Peter Korsten Peter and Christian Seider also of IBMs Institute for Business Value available at http://www-935.ibm.com/services/us/gbs/bus/html/ibv-smarter-planet-system-of-systems.html.
...
The link between water and health is significant – more than 50 percent of the world’s hospital beds are occupied by people suffering from water-related diseases, and 80 percent of diseases in developing countries are attributed to poor quality water.

Sunday, March 24, 2013

Biodiversity-Based Business in Peru Can Power Green Economy: UNEP Study

Goods and services derived from biodiversity (known as BioTrade) in Peru have grown by 20 per cent in the last five years, generating significant revenue and promoting sustainable development, while simultaneously supporting pro-poor development.

But despite these benefits, Peru's BioTrade sector still faces many challenges – from financing and value addition to certification and contamination from GMOs – which are preventing it from reaching its full potential.

These are among the findings of a new study released this week by the United Nations Environment Programme (UNEP) in collaboration with ProNaturaleza (Peruvian Foundation for the Nature Conservancy).

The study, BioTrade - A catalyst for transitioning to a green economy in Peru, shows that if the country could double its annual trade in biodiversity-based products to 40 per cent between now and 2020, it could increase sales from the 2009 level of US$ 110 million to US$ 2.7 billion. Such an increase would also add more than 250,000 new jobs over the next decade and increase carbon sequestration revenues from US$ 154 million to US$ 750 million.
A high-Andean plant (Senecio sanmarcosensis) new to science was discovered in Peru. It is part of the high-Andean wetlands vegetation. Courtesy ECOAN. 


www.EcoanPeru.org
Currently, there are more than 10,000 people working in Peru's BioTrade sector, mainly in rural areas, and they receive what is considered a fair price for their products. In general, prices for biodiversity products are 30 per cent above the average for other commodities in Peru, according to the study.

What Changes Energy Consumption, and for How Long? New Evidence from the 2001 Brazilian Electricity Crisis

Abstract:
There is little evidence from impact evaluation studies of ambitious residential energy conservation programs, especially in developing countries. In this paper, I investigate the short- and long-term impacts of the most ambitious electricity conservation program to date. This was an innovative program of private incentives and conservation appeals implemented by the Brazilian government in 2001-2002 in response to supply shortages of over 20%. I find that the program reduced average electricity consumption per customer by 25% over a nine-month period in affected areas. Importantly, the program reduced consumption by 12% in the long run [which corresponds to a reduction of $1.2 billion in electricity bills in 2011 or to a spared capacity of 850 MW, the capacity of an average nuclear reactor]. Such persistent effects, which arose mostly from behavioral adjustments, may substantially improve the cost-effectiveness of ambitious conservation programs. Finally, I show that a price elasticity estimated out-of-crisis would have to be increased fivefold to rationalize conservation efforts by the private incentives alone. Appeals to social preferences likely amplify consumers' responsiveness in times of crisis.
by Francois Gerard
Resources For the Future (RFF) www.RFF.org
RFF Discussion Paper 13-06; March, 2013
The full report is available free of charge at http://www.rff.org/RFF/Documents/RFF-DP-13-06.pdf

Saturday, March 23, 2013

Changes in implicit flood risk premiums: Empirical evidence from the housing market

Abstract:
Hedonic valuation models have shown that sales prices can capitalize property risk factors, such as flood zone; properties facing lower risk sell at a premium, all else being equal. Previous research has indicated that price differentials reflecting risk of flooding become much larger in the wake of a storm. We re-examine these findings for Pitt County, North Carolina, using multiple storm events within a difference-in-differences framework, and we compare flood zone price differentials for a more recent sample of property sales. Prior to Hurricane Fran in 1996, we detect no market risk premium for the presence in a flood zone, but we find significant price differentials after major flooding events, amounting to a 5.7% decrease after Hurricane Fran and 8.8% decrease after Hurricane Floyd. Results from a separate model that examines more recent data covering a period without significant storm-related flood impacts indicate a significant risk premium ranging between 6.0% and 20.2% for homes sold in the flood zone, but this effect is diminishing over time, essentially disappearing about 5 or 6 years after Hurricane Floyd. The lack of a persistent effect suggests that buyers’ and sellers’ risk perceptions may change with the prevalence of hazard events and that homebuyers are unaware of flood risks and insurance requirements when bidding on properties.

Full-size image (41 K) 
Fig. 1. Distribution of homes in flood zones sold 1992−2008: Pitt County, North Carolina.
Full-size image (21 K)   
Fig. 2. Effects of flood risk over time after Hurricane Floyd. 
by Okmyung Bin and Craig E. Landry E-mail the corresponding author both of Department of Economics, Center for Natural Hazards Research, East Carolina University, Greenville, NC 27858, United States; Fax: +1 252 328 6743 
Journal of Environmental Economics and Management via Elsevier Science Direct www.ScienceDirect.com
Available online 19 December 2012; In Press, Corrected Proof 
Keywords: Flood hazards; Hedonic prices; Availability bias; Spatial regression; Risk premium

New Reasons to Change Light Bulbs

... LED [light] bulbs ... have been slow to arrive, mainly because of their high price.... That’s a pity, because LED bulbs ... last about 25 times as long as incandescents and three times as long as CFLs; we’re talking maybe 25,000 hours of light....

You know how hot incandescent bulbs become. That’s because they convert only 5 to 10 percent of your electricity into light; they waste the rest as heat. LED bulbs are far more efficient. They convert 60 percent of their electricity into light, so they consume far less electricity. You pay less, you pollute less.

... There’s more: LED bulbs also turn on to full brightness instantly. They’re dimmable. The light color is wonderful; you can choose whiter or warmer bulbs. They’re rugged, too. It’s hard to break an LED bulb, but if the worst should come to pass, a special coating prevents flying shards. 

Yet despite all of these advantages, few people install LED lights. They never get farther than: “$30 for a light bulb? That’s nuts!” Never mind that they will save about $200 in replacement bulbs and electricity over 25 years. (More, if your electric company offers LED-lighting rebates.)
...
[However] LED bulbs now cost less than $10.  Plus several companies make bulbs that can be any color you want.

[David Pogue of the New York Times] tried out a "whole Times Square’s worth of LED bulbs and kits from six manufacturers."

3M ADVANCED LED BULBS On most LED bulbs, heat-dissipating fins adorn the stem. (The glass of an LED bulb never gets hot, but the circuitry does. And the cooler the bulb, the better its efficiency.) As a result, light shines out only from the top of the bulb.  But the 3M bulbs’ fins are low enough that you get lovely, omnidirectional light.These are weird-looking, though, with a strange reflective material in the glass and odd slots on top. You won’t care about aesthetics if the bulb is hidden in a lamp, but $25 each is unnecessarily expensive; read on. 

CREE LED BULBS Cree’s new home LED bulbs, available at Home Depot, start at $10 apiece, or $57 for a six-pack. That’s about as cheap as they come. The $10 bulb provides light equivalent to that from a 40-watt incandescent. Cree’s 60-watt equivalent is $14 for “daylight” light, $13 for warmer light.The great thing about these bulbs is that they look almost exactly like incandescent bulbs. Cree says that its bulbs are extraordinarily efficient; its “60-watt” daylight bulb consumes only nine watts of juice (compared with 13 watts on the 3M, for example).
The Cree Light Bulb www.cree.com
... 
By setting new brightness-per-watt standards that the 135-year-old incandescent technology can’t meet, the federal government has already effectively banned incandescent bulbs.
...
Separately (http://apps1.eere.energy.gov/news/progress_alerts.cfm/pa_id=855), on March 20, 2013 as part of the Obama Administration's efforts to reduce energy waste in our nation's buildings and help save Americans money by saving energy, the Energy Department today announced the winners of the fifth annual Next Generation Luminaires™ Design competition for indoor lighting at the LEDucation 7 conference in New York City. Sponsored by the Energy Department, the Illuminating Engineering Society of North America, and the International Association of Lighting Designers, the competition promotes excellence in the design of energy-efficient light-emitting diode (LED) commercial lighting fixtures, or "luminaires." Solid-state lighting technologies, which include both LED and organic light emitting diode technologies, have the potential to save Americans $30 billion a year in energy costs by 2030.

From Hopeless to Curious? Thoughts on Hausman’s “Dubious to Hopeless” Critique of Contingent Valuation

Abstract: 
Hausman (2012) “selectively” reviews the CVM literature and fails to find progress over the 18 years since Diamond and Hausman (1994) argued that unquantified benefits and costs are preferred to benefits and costs quantified by CVM for policy analysis. In these comments, we provide counter-arguments to the claims made by Hausman. We provide these counterarguments not with the intent to convince the reader that the debate over contingent valuation is settled but rather to urge the community of economists to recognize that the intellectual debate over contingent valuation is still ongoing and that plenty of work remains to be done. We review the literature and argue that (1) hypothetical bias raises important research questions about the incentives guiding survey responses and preference revelation in both real and hypothetical settings that contingent valuation can help answer, (2) the WTP-WTA gap debate is far from settled and the debate raises important research questions about the future design and use of benefit cost analyses of which contingent valuation will undoubtedly be a part, and (3) CVM studies do, in fact, tend to pass a scope test and there is little support for the assertion that an adding up test is the definitive test of CVM validity. 

by Timothy C. Haab, Matthew G. Interis, Daniel R. Petrolia and John C. Whtehead
Working Paper 13-07; 2013

Friday, March 22, 2013

Deutsche Bank: "Sustainable" solar market expected in 2014

Analysts at Deutsche Bank have predicted that the global solar PV sector will transition from a subsidised market to a sustainable market within a year, citing the arrival of “grid parity” in a number of key markets, with unexpectedly strong demand and rebounding margins.

The Deutsche Bank team said key markets such as India, China and the US are experiencing strong demand and solar projects are now being developed with minimal or no incentives.  “While some risks around subsidy cuts in Japan and the UK market remain, we expect a more constructive outlook in most other emerging markets,” Deutsche Bank writes. “We see the sector transitioning from subsidised to sustainable markets in 2014.”
...
The key for Deutsche is the emergence of unsubsidised markets in many key countries. It points, for instance, to India, where despite delays in the national solar program, huge demand for state based schemes has produced very competitive tenders, in the 12c/kWh range. Given the country’s high solar radiation profile and high electricity prices paid by industrial customers, it says several conglomerates are considering large scale implementation of solar for self consumption.

“Grid parity has been reached in India even despite the high cost of capital of around 10-12 per cent,” Deutsche Bank notes, and also despite a slight rise  in module prices of 3c-5c/kW in recent months(good for manufacturers).

Italy is another country that appears to be at grid parity, where several developers are under advanced discussions to develop unsubsidized projects in Southern Italy.
...
With system prices between €1,500 to €2,000/kW, net metering for systems below 200 kW and "advanced" plans for unsubsidized projects in the south of the country, Italy also "appears to be at grid parity". "Assuming small commercial enterprises are able to achieve 50% or more self consumption, solar is competitive with grid electricity in most parts of Italy," says Deutsche Bank....
Deutsche Bank states that utilization rates in China are on the increase, as are polysilicon, wafer and module prices. In particular, with an "improving" supply outlook, it predicts that polysilicon pricing will be kept under control, although prices are expected to remain below US$25/kg. This trend should see companies like Wacker Chemie and Hemlock ramp utilization rates back up.

In terms of crystalline silicon modules, says Deutsche Bank, Chinese tier-1 prices have been increasing by between $0.03 and $0.05/W. Consequently, it says, Chinese module prices are over $0.60/W, while European module prices are over $0.70/W....

America’s Infrastructure GPA Inches Up to a D+ on National Report Card

On March 19, 2013 The American Society of Civil Engineers (ASCE) released its 2013 Report Card for America’s Infrastructure, a comprehensive assessment of the nation’s infrastructure across 16 sectors.

Updated once every four years, this year’s Report Card found that America’s cumulative GPA for infrastructure rose slightly to a D+ from a D in 2009. The Report Card estimates total investment needs at $3.6 trillion by 2020 across all 16 sectors, leaving a funding shortfall of $1.6 trillion based on current funding levels.

The grades in 2013 range from a high of B- for solid waste infrastructure to a low of D- for inland waterways and levees. None of the categories received a lower grade than in 2009, however near-failing grades continue to be seen in numerous sectors that are crucial to the economy and Americans’ quality of life.

Encouraging trends were found in sectors where focused investments were made. Six sectors (solid waste, drinking water, wastewater, roads, bridges, and rail) each experienced incremental improvements since the last assessment. America’s rail sector saw the largest improvement, moving from a C- to a C+. 

TRENDS CONTRIBUTING TO RISING GRADES  
Key trends driving improvements included:
  • Renewed efforts in cities and states to address deficient roads, bridges, drinking water and wastewater systems;
  • Private investment for efficiency and connectivity brought improvements in the nation’s railways, ports, and energy grid;
  • Several categories benefited from short-term boosts in federal funding.
“A D+ is simply unacceptable for anyone serious about strengthening our nation’s economy; however, the 2013 Report Card shows that this problem can be solved. If we want to create jobs, increase trade, and assure the safety of our children, then infrastructure investment is the answer,” said ASCE President Gregory E. DiLoreto, P.E.

For the first time, the 2013 Report Card includes information for all 50 states and highlights initiatives and innovations that are making a difference. For example, Oklahoma created a plan to replace or rehabilitate over 950 structurally deficient bridges between 2013 and 2020. Philadelphia implemented a program to improve resiliency and address combined sewer overflows using green infrastructure, capable of capturing water from all but the most severe storms.

“We must commit today to investing in modern, efficient infrastructure systems to position the U.S. for economic prosperity,” added DiLoreto. “Infrastructure can either be the engine for long-term economic growth and employment, or, it can jeopardize our nation’s standing if poor roads, deficient bridges, and failing waterways continue to hurt our economy.”

REPORT CARD GRADES FOR SPECIFIC INFRASTRUCTURE SECTORS

Water and Environment
Dams again earned a grade of D, in part because of the increase in the nation’s aging and high-hazard dams. In fact, the average age of the country’s 84,000 dams is 52 years old. 
Drinking Water systems improved slightly to a grade of D. Frequent water main breaks, pipes and mains that are frequently more than 100 years old are reaching the end of their life cycle and require significant investment, and continue to account for the low grade.
 
[There are an estimated 240,000 water main breaks per year in the United States. Assuming every pipe would need to be replaced, the cost over the coming decades could reach more than $1 trillion, according to the American Water Works Association (AWWA).... There are an estimated 240,000 water main breaks per year in the United States.... In 2012, the American Water Works Association (AWWA) concluded that the aggregate replacement value for more than one million miles of pipes was approximately $2.1 trillion if all pipes were to be replaced at once. Since not all pipes need to be replaced immediately, it is estimated that the most urgent investments could be spread over 25 years at a cost of approximately $1 trillion.  “The need will double from roughly $13 billion a year today to almost $30 billion (in 2010 dollars) annually by the 2040s, and the cost will be met primarily through higher water bills and local fees.  “Delaying the investment can result in degrading water service, increasing water service disruptions, and increasing expenditures for emergency repairs. Ultimately we will have to face the need to ‘catch up’ with past deferred investments, and the more we delay the harder the job will be when the day of reckoning comes.” By 2050, the aggregate investment needs would total more than $1.7 trillion, according to the AWWA.  By contrast, the Environmental Protection Agency (EPA) needs estimates are more conservative as they do not factor in population growth. Their results in 2007 found a 20-year capital investment need of almost $334.8 billion for approximately 53,000 community water systems and 21,400 not-for-profit noncommunity water systems (including schools and churches). Among the major necessary investments, the nation required $199 billion for transmission and distribution systems, $67 billion for treatment systems, and $39 billion for water storage. The needs are greater than $1,000 per person in five regions: Far West, Great Lakes, Mid-Atlantic, Plains, and Southwest. Capital spending has not kept pace with needs for water infrastructure. The trend toward state and local governments’ assuming the bulk of the investment requirements in the coming decades will continue, with local governments’ paying an increasing share of the costs. In 2008, state and local governments estimated their total expenditures at $93 billion annually for wastewater and drinking water infrastructure. Congressional appropriations have declined over the five-year period 2008 to 2012, totaling only $6.9 billion—an average of $1.38 billion annually or $27.6 billion over 20 years, 8% of EPA’s identified needs over 20 years.]


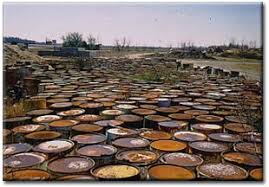
Hazardous Waste systems’ grade remained unchanged at a D. The undeniable success in the cleanup of the nation’s hazardous waste is diminished by a severe budgetary shortfall for Superfund and brownfield site cleanups. More than 400,000 brownfield sites await cleanup and redevelopment.

[Superfund is the common name for the Comprehensive Environmental Response, Compensation, and Liability Act of 1980 (CERCLA), a United States federal law designed to clean up sites contaminated with hazardous substances. Where responsible parties cannot be found, the Agency is authorized to clean up sites itself, using a special trust fund. There has been undeniable success in the cleanup of the nation’s hazardous waste and brownfields sites. However, annual funding for Superfund site cleanup is estimated to be as much as $500 million short of what is needed, and 1,280 sites remain on the National Priorities List with an unknown number of potential sites yet to be identified. More than 400,000 brownfields sites await cleanup and redevelopment....Since 1980, the EPA has investigated more than 47,000 sites suspected of releasing hazardous substances into the environment. Just over 1,600 sites have been placed on the NPL, and cleanup has been implemented at more than two-thirds of those sites.  The EPA is also charged with identifying the parties responsible for contamination of NPL sites and enforcing the cleanup of sites. Organizations that EPA has deemed “potentially responsible parties” have funded cleanup of more than 70% of the sites on the NPL, at an estimated value of nearly $30 billion.  That still leaves a lot of sites that are not funded by responsible parties.  The reasons for this are many but include the party no longer exists or has no money.  Even as needs have grown, annual congressional appropriations for Superfund have declined by 40% since its peak of $2 billion in 1998. The Superfund program has in the past received funding from two sources: general funds from the U.S.Treasury and balances in the Superfund trust fund. Prior to 1996, revenues for the trust fund came from dedicated excise taxes and an environmental corporate income tax. Those taxes expired in December 1995 and have not be replaced.]
Levees again earned a near failing grade of D-. The U.S. does not have a levee safety program. Public safety remains at risk as roughly $100 billion is needed to repair the nation’s estimated 100,000 miles of levees that increasingly are protecting developed communities. However, the return on investment is clear. Levees helped to prevent more than $141 billion in flood damages in 2011.Solid Waste systems earned the highest grade in 2013 of a B-. In 2010, Americans recycled 85 million tons of the 250 million tons of trash generated. This represents a 34 percent recycling rate, more than double the 14.5 percent recycled in 1980. 
Wastewater systems improved slightly to a grade of D. Capital investment needs for the nation’s wastewater and stormwater systems, namely to fix and expand pipes to address sanitary sewer overflows, combined sewer overflows, and other pipe-related issues, are estimated to total $298 billion over the next 20 years.

The long-run impact of nuclear waste shipments on the property market: Evidence from a quasi-experiment

Abstract:
We use evidence from a quasi-experiment – the shipping of radioactive spent nuclear fuel by train through South Carolina – to assess whether many years of incident-free transport of nuclear waste no longer negatively affects market valuation of properties along the route. Using Charleston County (SC) property sales data over 13 years we find, to the contrary, that the negative impact of the nuclear waste shipments on property values continues to be felt over the long run. The perception of risk from nuclear waste transport appears to be resilient. We contribute methodologically by comparing well-defined treatment and control groups of properties to estimate the average treatment effect of the nuclear waste shipment program. The results are affirmed in both a pooled cross-section sample, as well as a panel data sample of repeated property sales.  The three-year moving average of the diminution rises from about 4% to 9% then declines to 7%.
Full-size image (47 K) 
Fig. 3. Annual average treatment effects (ATT) and two-standard deviation confidence intervals: 3-year (sample-weighted) moving average. Top panel: average treatment effect for treated properties (% of sale price). Bottom panel: distance effect in ATT: % increase in sale price of treated properties per km away from SNF route 
a Bush School of Government and Public Service, Texas A&M University, College Station, TX 77843-4220, United States; Corresponding author. Fax: +1 979 845 4155 
b Department of Political Science, University of Oklahoma, United States
c College of Atmospheric and Geographic Sciences, University of Oklahoma, United States
Journal of Environmental Economics and Management via Elsevier Science Direct  www.ScienceDirect.com 
Volume 65, Issue 1; January, 2013; Pages 56–73
Keywords: Spent nuclear fuel; Average treatment effect; Difference-in-differences; Pooled cross-section; Panel

A Bioeconomic Analysis of Traditional Fisheries in the Red Sea

Abstract:
We undertake a bioeconomic analysis of the aggregate traditional fisheries in the Northern and Central areas of Red Sea off the coast of the Kingdom of Saudi Arabia (KSA). Results of our analysis using a Fox model and the Clarke-Yoshimoto- Pooley (CY&P) estimation procedure suggest that the aggregate traditional fisheries have been overfished since the early 1990s. The estimated stock size in recent years is as low as 6,400 MT, while the estimated stock size associated with the maximum economic yield (MEY) is 19,300 MT. The socially optimal level of fishing effort is about 139,000 days. Thus, the current effort level of 300,000 to 350,000 days constitutes a problem of overfishing. The estimated current total gross revenue from the traditional fisheries is Saudi Rials (SR) 147 million with zero net benefit. If total fishing effort is reduced to the socially optimal level, then we estimate gross revenue would be SR 167 million and the potential net benefit from the KSA Red Sea traditional fisheries could be as large as SR 111 million.
by Di Hin 1, Hauke Kite-Powell 2, Porter Hoagland 3 and Andrew Solow 4 all of the Marine Policy Center, Woods Hole Oceanographic Institution, Woods Hole, MA 02543 USA.
Marine Resource Economics http://marineresourceeconomics.com
Volume 27, Number 2; June, 2012; pages 137-148.
1. Senior Scientist ()
2. Research Specialist ()
3. Senior Research Specialist ()
4. Senior Scientist and Director ()

Air Pollution and Infant Mortality: Evidence from the Expansion of Natural Gas Infrastructure

Abstract:
One of the consequences of rapid economic growth and industrialization in the developing world has been deterioration in environmental conditions and air quality. While air pollution is a serious threat to health in most developing countries, environmental regulations are rare and the determination to address the problem is weak due to ongoing pressures to sustain robust economic growth. Under these constraints, natural gas, as a clean, abundant, and highly-efficient source of energy, has emerged as an increasingly attractive source of fuel, which could address some of the environmental and health challenges faced by these countries without undermining their economies. In this paper, we examine the impact of air pollution on infant mortality in Turkey using variation across provinces and over time in the adoption of natural gas as a cleaner fuel. Our results indicate that the expansion of natural gas infrastructure has caused a significant decrease in the rate of infant mortality in Turkey. In particular, a one-percentage point increase in the rate of subscriptions to natural gas services would cause the infant mortality rate to decline by 4 percent, which could result in 348 infant lives saved in 2011 alone. These results are robust to a large number of specifications. Finally, we use supplemental data on total particulate matter and sulfur dioxide to produce direct estimates of the effects of these pollutants on infant mortality using natural gas expansion as an instrument. Our elasticity estimates from the instrumental variable analysis are 1.25 for particulate matter and 0.63 for sulfur dioxide.

by Resul Cesur, Erdal Tekin and Aydogan Ulker
National Bureau of Economic Research (NBER) www.NBER.org
NBER Working Paper No. 18736; Issued in January 2013

Study Finds 100 percent Renewable Electricity Possible on Long Island by 2030

The Long Island Clean Electricity Vision, commissioned by Renewable Energy Long Island (reLI) and environmental, public interest, and other advocacy organizations, finds that 100 percent clean, renewable electricity is now possible for Long Island.

The analysis, performed by Synapse Energy Economics, concludes that a clean energy transition could take place within two decades, at relatively modest cost and with significant benefits. Such findings are timely given that Long Island is at an energy crossroads, with the Long Island Power Authority facing long-term power purchase decisions as many fossil fuel power purchase agreements expire in 2013.

Key findings of the Long Island Clean Electricity Vision are: · Using cautious assumptions, it appears technically feasible that renewable energy sources can supply all residential electricity needs by 2020. · By 2030 all of Long Island could have a 100 percent renewable and zero-carbon electricity supply. · Aggressive energy efficiency efforts, large scale wind, solar and other renewable energy technologies would need to be built to replace old, inefficient fossil-fueled power plants. · During times when not enough renewable energy is available to meet electricity demand, some existing fossil-fueled power generation would be used to meet demand, but renewable energy credits would be purchased to offset their emissions.

The study was based exclusively on technologies which are commercially available today. “We now have everything we need to make the transition from dirty and dangerous fossil fuels to a clean, and renewable electricity supply,” said Gordian Raacke, Executive Director of Renewable Energy Long Island, a regional not-for-profit organization...
 
While this is the first study examining a 100 percent renewable energy future for Long Island, numerous other studies have come to similar conclusions for other regions. [They include a 2012 National Renewable Energy Laboratory study for the entire U.S. (Renewable Electricity Futures Study http://www.nrel.gov/analysis/re_futures/ ), a world-wide study by Jacobson/Delucchi (Stanford University) A Plan to Power 100 Percent of the Planet with Renewables, http://www.scientificamerican.com/article.cfm?id=a-path-to-sustainable-energy-by-2030, and a World Wildlife Fund study, The Energy Report – 100% Renewable Energy by 2050 http://www.panda.org/energyreport. And, many regions already have goals for 100% renewable energy, and some are well on their way or are already meeting these goals. Examples include Scotland and Denmark, as well as the cities of San Francisco, CA and Munich, Germany.]
...
The study finds that the cost of switching to a 100 percent renewable electricity supply is modest: average customer bills are estimated to increase by roughly 8 to 12 percent. On a typical monthly LIPA bill, this amounts to $12 to $18, or the cost of a pizza. The indirect cost of current fossil fuel use to individuals and society, such as environmental and health-related costs from pollution, are not considered in this comparison.

Monday, March 18, 2013

Examining the feasibility of converting New York State’s all-purpose energy infrastructure to one using wind, water, and sunlight

Abstract:
This study analyzes a plan to convert New York State's (NYS's) all-purpose (for electricity, transportation, heating/cooling, and industry) energy infrastructure to one derived entirely from wind, water, and sunlight (WWS) generating electricity and electrolytic hydrogen. Under the plan, NYS's 2030 all-purpose end-use power would be provided by 10% onshore wind (4020 5-MW turbines), 40% offshore wind (12,700 5-MW turbines), 10% concentrated solar (387 100-MW plants), 10% solar-PV plants (828 50-MW plants), 6% residential rooftop PV (∼5 million 5-kW systems), 12% commercial/government rooftop PV (∼500,000 100-kW systems), 5% geothermal (36 100-MW plants), 0.5% wave (1910 0.75-MW devices), 1% tidal (2600 1-MW turbines), and 5.5% hydroelectric (6.6 1300-MW plants, of which 89% exist). The conversion would reduce NYS's end-use power demand ∼37% and stabilize energy prices since fuel costs would be zero. It would create more jobs than lost because nearly all NYS energy would now be produced in-state. NYS air pollution mortality and its costs would decline by ∼4000 (1200–7600) deaths/yr, and $33 (10–76) billion/yr (3% of 2010 NYS GDP), respectively, alone repaying the 271 GW installed power needed within ∼17 years, before accounting for electricity sales. NYS's own emission decreases would reduce 2050 U.S. climate costs by ∼$3.2 billion/yr.
Highlights
► New York State's all-purpose energy can be derived from wind, water, and sunlight.
► The conversion reduces NYS end-use power demand by ∼37%.
► The plan creates more jobs than lost since most energy will be from in state.
► The plan creates long-term energy price stability since fuel costs will be zero.
► The plan decreases air pollution deaths 4000/yr ($33 billion/yr or 3% of NYS GDP).


Full-size image (37 K) 
Fig. 1. Spacing and footprint areas required to implement the plan proposed here for NYS, as derived in Table 2. Actual locations would differ. The dots are only representative areas. For wind, the small red dot in the middle is footprint on the ground and the blue is spacing. For the others, the footprint and spacing are similar to each other. In the case of rooftop PV, the dot represents the rooftop area to be used. (For interpretation of the references to colour in this figure legend, the reader is referred to the web version of this article.)Full-size image (43 K) 
Fig. 2. Capacity factors at 90-m hub height in NYS and offshore in Lake Ontario, Lake Erie, and the Eastern seaboard, as calculated with a 3-D computer model evaluated against data assuming 5-MW RE-Power wind turbines with rotor diameter D=126 m from simulations run in 26 and 27. Capacity factors of 30% or higher are the most cost-effective for wind energy development.
by Mark Z. Jacobsona, E-mail the corresponding author, Robert W. Howarthb, Mark A. Delucchic, Stan R. Scobied, Jannette M. Barthe, Michael J. Dvoraka, Megan Klevzea, Hind Katkhudaa, Brian Mirandaa, Navid A. Chowdhurya, Rick Jonesa, Larson Planoa, and Anthony R. Ingraffeaf    
a Atmosphere/Energy Program, Department of Civil and Environmental Engineering, Stanford University, Stanford, CA 94305, USA; Tel.: +1 650 723 6836.   
b Department of Ecology and Evolutionary Biology, Cornell University Ithaca, NY 14853, USA  
c Institute of Transportation Studies, U.C. Davis, Davis, CA 95616, USA
d PSE Healthy Energy, NY, USA 
e Pepacton Institute LLC, USA 
f School of Civil and Environmental Engineering, Cornell University, Ithaca, NY 14853, USA
The full paper is currently available free of charge at http://www.stanford.edu/group/efmh/jacobson/Articles/I/NewYorkWWSEnPolicy.pdf
Energy Policy via Elsevier Science Direct www.ScienceDirect.com
Available online 13 March 2013; In Press, Corrected Proof
via/hat tip http://dotearth.blogs.nytimes.com/2013/03/12/can-wind-water-and-sunlight-power-new-york-by-2050/
Keywords: Renewable energy; Air pollution; Global warming