Monday, October 1, 2018

State Corporation Commision: Virginia could save $1.7B with more solar, efficiency resources

Independent analysis of Dominion Energy’s Integrated Resource Plan shows opportunity for ratepayer savings with addition of solar and energy efficiency resources, reducing energy imports

On September 24, 2018 Virginia Advanced Energy Economy (Virginia AEE) testified that Virginia Electric and Power Company's (Dominion Energy's) long-term energy resource plan misses key opportunities to reduce ratepayer costs and out-of-state energy imports to the Commonwealth by investing in renewables and energy efficiency.

In his testimony before the State Corporation Commission (SCC), Virginia AEE Executive Director Harry Godfrey shared highlights of independent analysis using assumptions and forecasts from the utility’s submitted 2018 Integrated Resource Plan (IRP). He reported that, by allowing for more low-cost solar and energy efficiency resources, Dominion’s electricity system costs would drop between $700M and $1.7B, providing cost savings for residential and business customers. Also, advanced energy options had the added benefits of reducing energy imports and supporting a framework for participation in future carbon reduction programs. Godfrey’s testimony drew from formal comments* submitted to the SCC on Dominion’s IRP.

“Our analysis definitively shows that Dominion has limited its opportunities to save ratepayers money by not allowing for the development of more least-cost resources like solar energy and energy efficiency,” said Harry Godfrey, Executive Director of Virginia Advanced Energy Economy (Virginia AEE). “By lifting the utility’s overly restrictive limits on renewables and energy efficiency, we can reduce costs by up to $1.7 billion for residents and businesses and reduce energy imports from out of state.”

For its analysis, Virginia AEE hired 5 Lakes Energy, an expert consulting firm focused on economic and energy policy. 5 Lakes’ employed the State Tool for Electricity Planning (STEP), a least-cost resource-planning tool specifically tailored to Virginia, to analyze five possible policy scenarios that Dominion used in its IRP. 5 Lakes consultants employed the same set of assumptions employed by Dominion, as well as the utility’s projections regarding future load growth, fuel prices, and emission allowances.

“Our analysis presents a no-regrets option for all Virginians, whereby we can save ratepayers up to $1.7 billion over the next 15 years while producing secure, clean, affordable energy,” said Godfrey. “By sourcing more energy resources in the Commonwealth, we gain the associated economic impact, including sustaining and growing the nearly 100,000 advanced energy jobs here in the Commonwealth.”

In August, Virginia AEE released a fact sheet showing that Virginia has 97,700 people working in advanced energy across the state, and are expected to increase by 5% this year. This represents more than those employed by groceries and supermarkets (75,133), and twice as many as those at hotels, motels, and resorts (45,777) across the state. Virginia advanced energy jobs were led by those in energy efficiency and energy generation resources such as solar, nuclear and wind. The U.S. has a total of 3.4 million working in advanced energy jobs across the nation.

Virginia AEE members have identified five policy priorities that could further accelerate this growth and positive economic impact:
  • Improving Energy Productivity
  • Expanding Market Access
  • Driving Transportation Electrification
  • Accelerating Renewable Energy Deployment
  • Building a 21st Century Energy System

Godfrey’s testimony came at the start of two days of hearings on Dominion’s 2018 IRP before the State Corporation Commission. The Commission is expected to deliberate on the matter and issue a final ruling in the months ahead.
solar facility (farm) built by Community Energy Solar in Accomack County
solar facility ("farm") built by Community Energy Solar in Accomack County
Source: VA Dep't  of Mines, Minerals, and Energy, Energy in the New Virginia Economy: Update to the 2014 Virginia Energy Plan

Virginia, Advanced Energy Economy (AEE) https://www.aee.net, a group of businesses that are making the energy we use secure, clean, and affordable which seeks to drive the development of advanced energy to boost the state’s economy and competitiveness by working to remove policy barriers, identify market growth opportunities, encourage market-based policies, establish public and private partnerships, and serve as the voice for companies innovating in the advanced energy sector.
Press Release dated September 24, 2018

Sunday, September 30, 2018

Municipal wastewater treatment costs with an emphasis on assimilation wetlands in the Louisiana coastal zone

Highlights:
• Cost for assimilation wetlands averaged $0.60/gallon of treatment capacity.
• 2° and 3° treatment costs averaged $4.90 and $6.50/gallon, respectively.
• Wetland assimilation is less sensitive to cost increases than traditional systems.

Abstract:
In recent decades, water quality standards for wastewater treatment have become more stringent, increasing costs and energy required to reduce pollutants. Wetland assimilation is a low-cost and low-energy alternative to traditional tertiary wastewater treatment where secondarily treated and disinfected municipal effluent is discharged primarily into freshwater forested wetlands in coastal Louisiana. In this paper, costs per gallon of treatment capacity for conventional secondary and tertiary treatment were compared to those for assimilation wetlands. Cost analysis reports were used to determine costs per gallon of treatment capacity for conventional wastewater treatment facilities, including costs for conveyance between the collection system and the assimilation wetland site, and between the treatment and disposal sites if they could not be co-located. Capital and operation and maintenance costs were considered. Because all wastewater treatment plants are required to treat at least to secondary standards, costs for primary and secondary treatment were combined. If necessary, these costs were adjusted for inflation to 2017 dollars using an average inflation rate of 2.19 percent and a cumulative inflation rate of 50.84 percent. To determine costs per gallon of treatment capacity for assimilation wetlands, actual costs provided by the project engineer were used when available. To simulate the future costs of facility construction and compare the replacement costs of conventional secondary and tertiary wastewater treatment facilities and treatment wetlands in the context of energy prices, U.S. Bureau of Labor and Statistics (BLS) data for the price index for inputs to construction were used, as were the Energy Information Administration (EIA) data for the price of crude oil to model future wastewater treatment plant construction and operation costs. The cost for the Mandeville assimilation wetland included $1 million for the price of the land. Future costs of treatment facility construction and operation were modeled relative to average price of construction inputs between 1998 and 2015 using the projected price of crude oil. When treatment costs were compared among secondary, tertiary, and assimilation wetlands, mean cost for assimilation wetlands was $0.60 per gallon (>1 MGD capacity) compared to $4.90 and $6.50 per gallon for secondary and tertiary treatment, respectively. The lower total costs and energy requirements for assimilation wetlands result in lower variability in the price of construction and operation. Wetland assimilation is more economical than conventional wastewater treatment, especially compared to advanced secondary and tertiary treatment. It is likely that energy costs will increase significantly in coming decades. Because conventional secondary and tertiary treatment are energy intensive, increases in energy costs will significantly increase the costs of these treatment systems. Treatment systems that combine lower technology (e.g., oxidation ponds) secondary treatment with wetland assimilation are less likely to be impacted by rising energy costs than traditional wastewater treatment.
by Rachael G.Hunter 1, John W.Day 1 and 2, Adrian R.Wiegman 3, Robert R.Lane 1
1. Comite Resources, Box 66596, Baton Rouge, LA 70896, USA
2. Dept. of Oceanography and Coastal Science, Louisiana State University, Baton Rouge, LA 70803, USA1
3. Rubenstein School of Natural Resources, University of Vermont, Burlington, VT 05401, USA
https://doi.org/10.1016/j.ecoleng.2018.09.020
Ecological Engineering
Available online 25 September 2018

Saturday, September 29, 2018

Country-level social cost of carbon

Abstract:
The social cost of carbon (SCC) is a commonly employed metric of the expected economic damages from carbon dioxide (CO2) emissions. Although useful in an optimal policy context, a world-level approach obscures the heterogeneous geography of climate damage and vast differences in country-level contributions to the global SCC, as well as climate and socio-economic uncertainties, which are larger at the regional level. Here we estimate country-level contributions to the SCC using recent climate model projections, empirical climate-driven economic damage estimations and socio-economic projections. Central specifications show high global SCC values (median, US$417 per tonne of CO2 (tCO2); 66% confidence intervals, US$177–805 per tCO2) and a country-level SCC that is unequally distributed. However, the relative ranking of countries is robust to different specifications: countries that incur large fractions of the global cost consistently include India, China, Saudi Arabia and the United States.

by Katharine Ricke, Laurent Drouet, Ken Caldeira & Massimo Tavoni 
Nature Climate Change
Volume 8, Published: 24 September 2018; pages 895–900

which appeared in Inside Climate News Stacy Morford notes that the future economic costs within the U.S. borders are the second-highest in the world, behind only India."
The results suggest that the U.S. has been underestimating how much it benefits from reducing its greenhouse gas emissions and that the country has far more to gain from international climate agreements than the Trump administration is willing to admit.
"Our analysis demonstrates that the argument that the primary beneficiaries of reductions in carbon dioxide emissions would be other countries is a total myth," said lead author Kate Ricke, an assistant professor at the University of San Diego's School of Global Policy and Strategy and Scripps Institution of Oceanography.
Some smaller countries are expected to lose significantly larger portions of their economies to climate change. But the authors found, after modeling hundreds of scenarios, that the U.S. consistently faces among the costliest damages, as measured by what economists call the social cost of carbon....
The U.S.'s share of the global damage, about 12 percent according to the study, is slightly less than its share of the global emissions. But India's share of the damage is four times higher than its contribution.
Countries' share of global social cost of carbon vs. share of global emissions
The case of Russia shows how some of the major emitters could even gain from rising temperatures, as a warming Siberia would benefit Russia economically in the short term, according to the findings, (though the estimates don't account for longer-term impacts the country will face, such as damage to Arctic ecosystems and the rising ocean). Northern Europe and Canada also could have low costs or even short-term net benefits from CO2 emissions, according to the estimates.
If these countries only considered the current economic impact within their borders, they would appear to have little incentive to cut their emissions.
...
The U.S. government uses a social cost of carbon in its cost-benefit analyses when it designs new environmental regulations or rewrites old ones, but its numbers are much lower than those in the study.
The Obama administration set its median social cost of carbon at about $42 per metric ton for 2020. It based that on calculations of the global harm being created by each ton of U.S. emissions. When the Trump administration came in, it argued that the social cost of carbon should only address the impact on the U.S., and it wanted a higher discount rate. When the Trump administration issued its cost-benefit analysis for rolling back the Clean Power Plan, it cited numbers closer to $3 per ton.
Looking just at the impact within U.S. borders, the new study estimates the U.S. social cost of carbon emissions is nearly $48 per ton.
That wouldn't support the Trump administration's plans for weakening the Clean Power Plan and energy efficiency standards.

SAFE Issue Brief Highlights Military Cost of Protecting Global Oil Supply

According to the calculations of the Environmental Protection Agency (EPA) and the National Highway Traffic Safety Administration (NHTSA), the cost to the United States of defending the global oil supply is zero. This zero-cost estimate comes from the methodology used by the U.S. government budgets for national defense. Since it is difficult to assign a cost to the oil protection mission—and since the Department of Defense (DoD) would realize no savings if this mission were not pursued—EPA and NHTSA conclude that it is pointless to assign any value above zero for this activity. This approach fails to account for the large opportunity costs of protecting the global oil supply.

To more accurately assess the military cost to the U.S. of protecting global oil supplies—and therefore understanding the military cost/benefit of the Fuel Economy Standards (FES) program—SAFE conducted an extensive review of the existing literature that analyzes the military cost of U.S. oil dependence. In addition, SAFE carried out a series of interviews with military members of its Energy Security Leadership Council (ESLC) as well as other leading experts in this field.
  • At minimum, approximately $81 billion per year is spent by the U.S. military protecting global oil supplies. This is approximately 16 percent of recent DoD base budgets. Spread out over the 19.8 million barrels of oil consumed daily in the U.S. in 2017, the implicit subsidy for all petroleum consumers is approximately $11.25 per barrel of crude oil, or $0.28 per gallon. A more extensive estimate by two highly-regarded economists suggests the costs could be greater than $30 per barrel, or over $0.70 per gallon.
  • America’s dependence on oil as the primary transportation fuel has costs beyond those directly shown at the gas pump. SAFE and its ESLC strongly believe based on first hand experience that the military cost of oil dependence is substantially greater than zero, and argue that a cost of at least $0.28 per gallon should be used by EPA and NHTSA in their military cost/benefit analysis for the FES program.
  • Reducing oil use in the transportation sector allows for the possibility of shifting U.S. military priorities toward more critical strategic threats. “If we reduced our oil consumption by half, [the U.S. military] would act differently,” says ESLC member Admiral Dennis C. Blair, the former Director of National Intelligence and Commander in Chief of the U.S. Pacific Command. General Duncan McNabb, the former commander of the U.S. Transportation Command and also a member of SAFE’s ESLC stated: “If we can reduce our dependence on oil, we could reduce our presence in the Gulf and use the funds for other critical military priorities, like cybersecurity or hypersonic weapons. The same funds could support different security priorities. We would make different choices, that would make us safer and more secure.”
The full report can be found here.

Securing America's Future Energy https://secureenergy.org
Press Release dated September 20, 2018
via/hat tip "We now have a dollar value for one of oil’s biggest subsidies - Defending the oil supply costs a lot of money" By David Roberts@drvox  https://www.vox.com/energy-and-environment/2018/9/21/17885832/oil-subsidies-military-protection-supplies-safe

Friday, September 28, 2018

Japanese knotweed knocks £20bn off value of UK property market - It is estimated that up to 900,000 UK households are affected by the weed, which the Environment Agency describes as one of the ‘most aggressive, destructive and invasive plants’

Japanese knotweed has knocked £20bn off the total value of the UK property market, according to new research, with many mortgage lenders refusing loans for properties affected by the weed.

Japanese knotweed is an ornamental plant that first came to the UK in the 1850s. Now it is one of “the UK’s most aggressive, destructive and invasive plants” according to the Environment Agency, due to its ability to spread through tarmac, concrete, driveways and drains.

A recent survey by YouGov and Environet UK, which specialises in removing the weed, found that around 5 per cent of UK houses are currently affected by knotweed, either directly or indirectly (when a neighbouring property is affected).
...
According to the latest Land Registry price index, the average UK house costs £228,000. The presence of Japanese knotweed has diminished the value of affected houses by 10 percent, creating an average loss of £22,800 to property owners.

It is estimated that between 850,000 and 900,000 UK households are affected by the Japanese plant....
File:Fallopia japonica - Japanese knotweed, Japanintatar, Parkslide C IMG 6997.JPG
Japanese knotweed also appeared in several high profile legal cases this year, as landowners were successfully sued for allowing the plant to spread into neighbouring properties.

Marc Montaldo of Cobley’s Solicitors, who specialises in Japanese knotweed litigations, said: “In legal cases relating to diminution in value due to knotweed, we typically see claims for around 10 perent of the property’s value. This is due to the stigma attached to knotweed impacting its future sale price.”

Sellers are now required to inform future buyers whether the property is or has been affected by Japanese knotweed even if it the plant has been removed.

Furthermore, mortgage lenders will usually refuse to give out loans unless property owners have a knotweed management plan with an insurance-backed guarantee in place.
...
by Cristian Angeloni
FOR FULL STORY GO TO:
The Independent https://www.independent.co.uk
September 28, 2018

Sunday, September 16, 2018

Berkeley Lab’s “Utility-Scale Solar” documents an expanding U.S. market

... The 2018 edition of Berkeley Lab’s Utility-Scale Solar report ... presents [an] analysis of empirical project-level data from the U.S. fleet of ground-mounted solar projects with capacities exceeding 5 MW-AC.... [The] report explores trends in deployment and project design, installed project prices, operating costs, capacity factors, power purchase agreement (PPA) prices, and the levelized cost of energy (LCOE) among both utility-scale photovoltaic (PV) and concentrating solar-thermal power (CSP) projects.

Key findings from this year’s edition of this annual report series include:
  • The utility-scale PV market continues to expand geographically across the United States, with 33 states home to one or more utility-scale solar projects at the end of 2017.  For the first time in the history of the U.S. market, the lion’s share (70%) of new solar capacity added in 2017 is located outside of historical strongholds California and the Southwest, with the Southeast in particular accounting for 40% of all new capacity.  
  • Projects that track the sun throughout the day continued to dominate fixed-tilt projects, with nearly 80% of all new utility-scale PV capacity added in 2017 employing single-axis tracking.
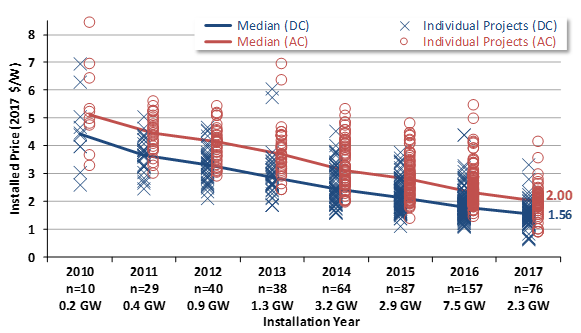
  • Median installed project prices declined to $2.0/WAC (or $1.6/WDC) in 2017, with the lowest 20th percentile priced at or below $1.8/WAC (or $1.3/WDC). 
  • Project-level capacity factors vary widely, from 14%-35% (on an AC basis), based on a number of factors, including insolation, tracking vs. fixed-tilt, and inverter loading ratio. On an average fleetwide basis, AC capacity factors have stabilized at around 27% in recent years as the increasing use of tracking compensates for the build-out of lower-insolation sites.
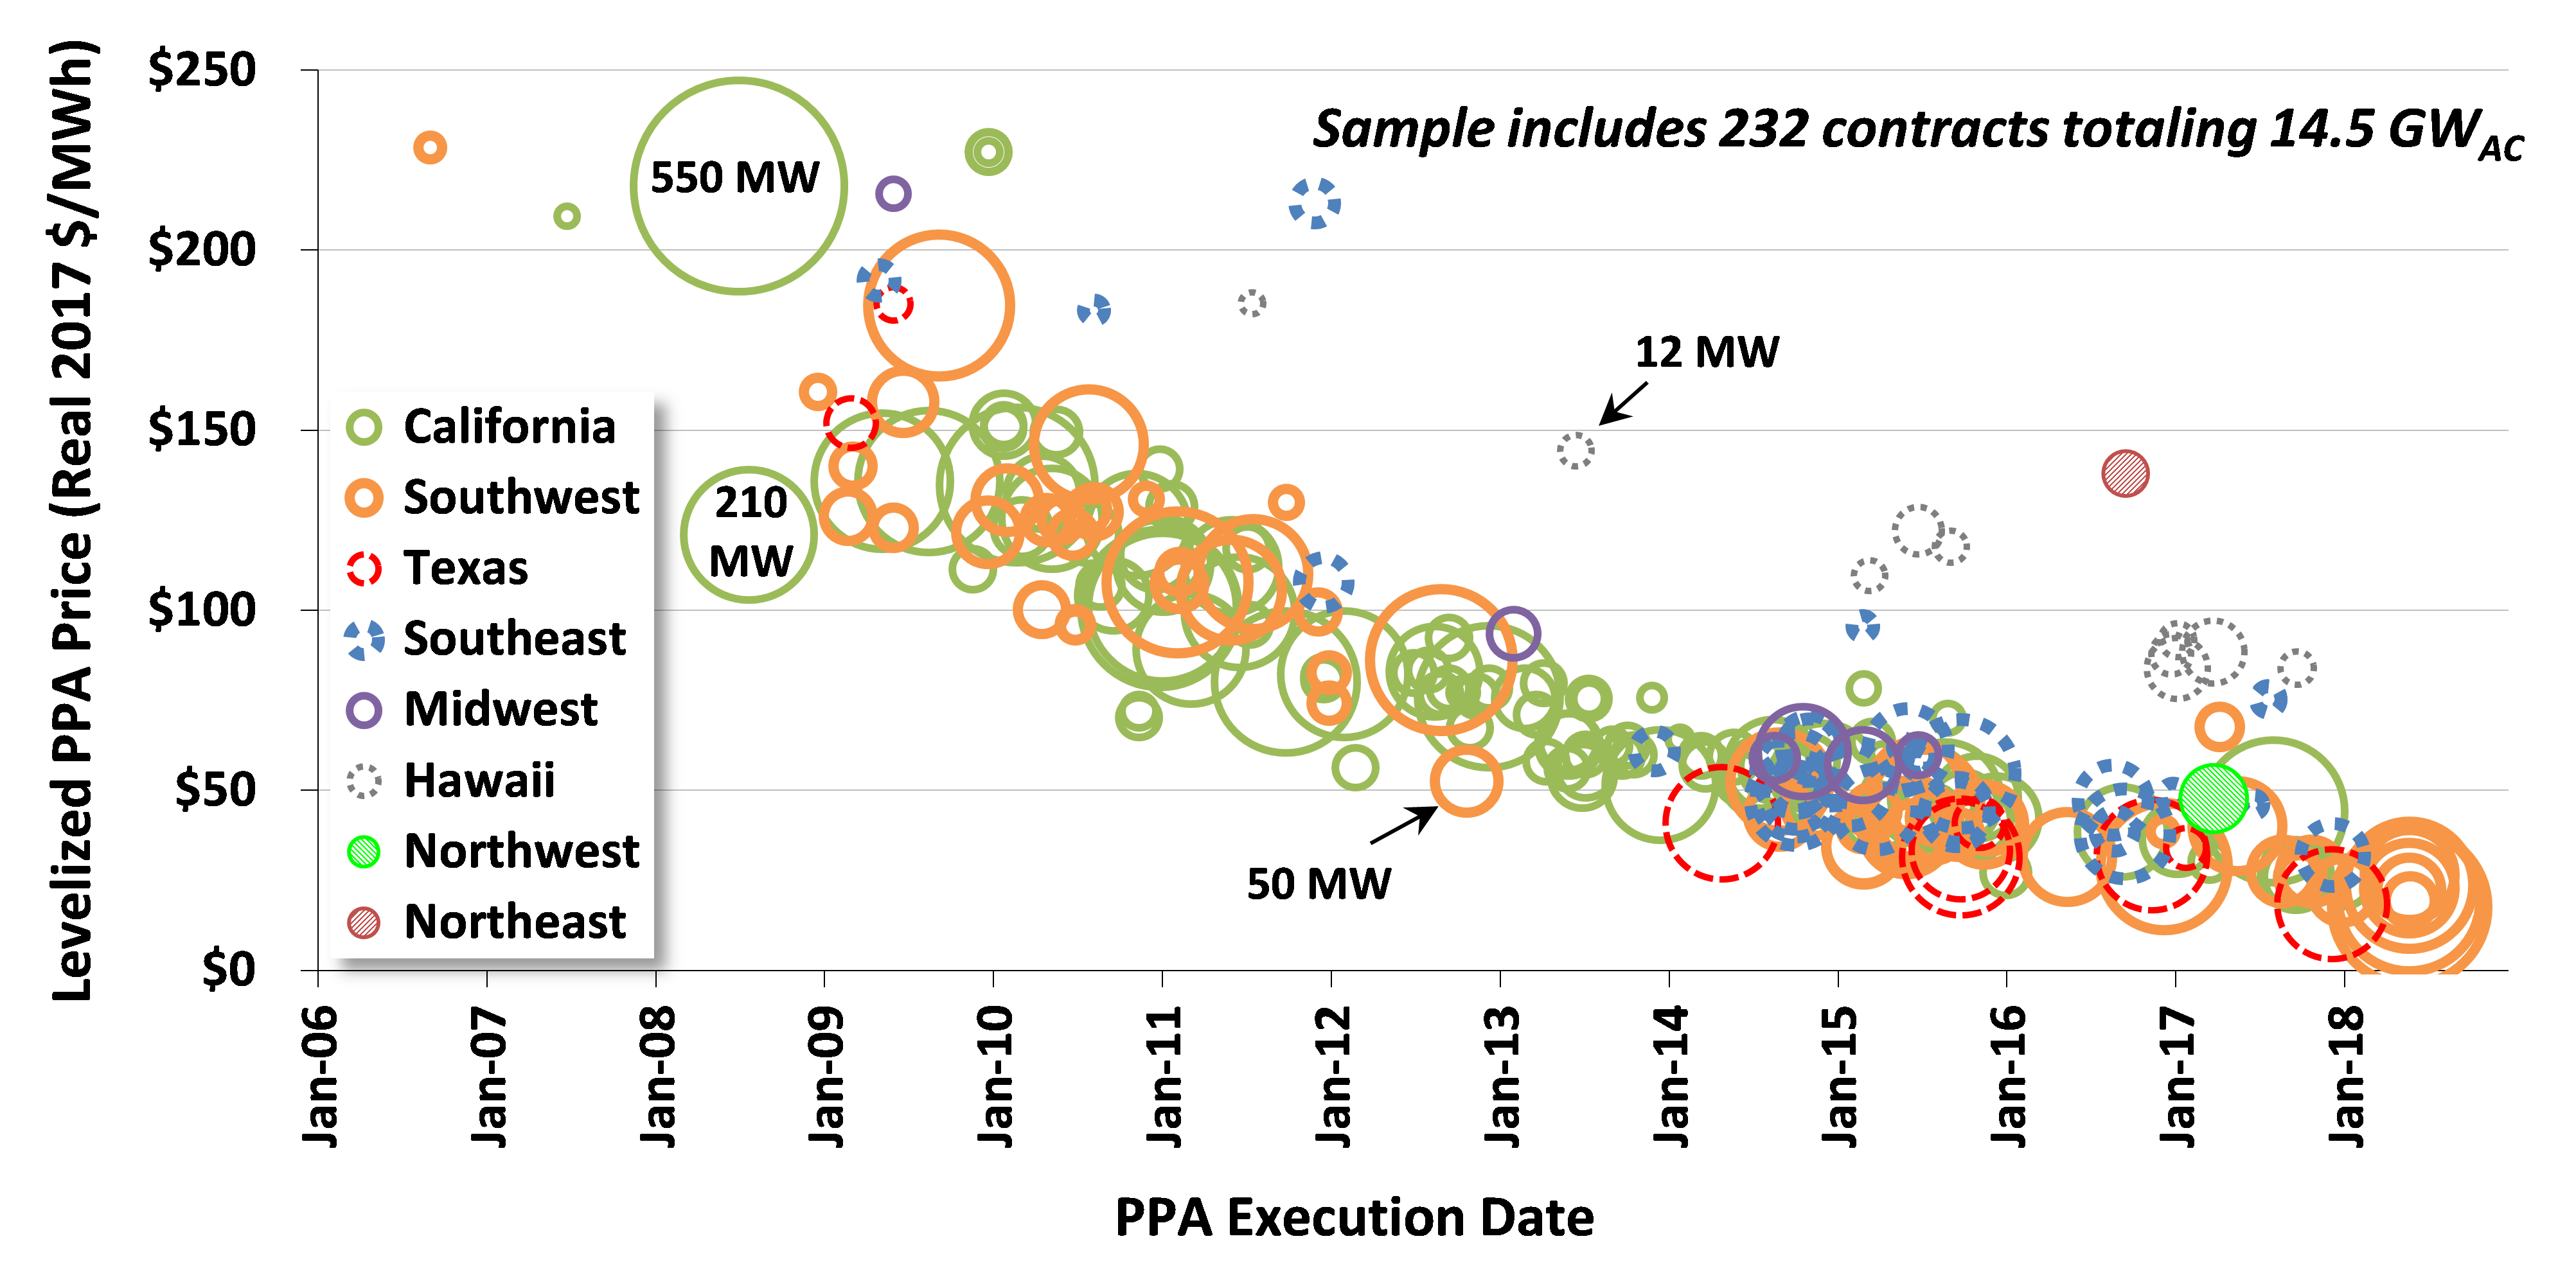
  • PPA prices continued to decline, to below $40/MWh on average and with a few as low as $20/MWh (levelized, in 2017 dollars).

  • These falling PPA prices have been offset to some degree by declining wholesale market value within a few high-penetration markets like California, where an abundance of mid-day solar generation has suppressed wholesale power prices (see the text box on page 37 of the full report).
  • Adding battery storage to shift a portion of this excess mid-day solar generation into evening hours is one way to partially restore the wholesale market value of solar. Recent PPAs for PV plus battery storage projects suggest that this technology combination has become significantly cheaper than it was just a year ago, and is increasingly attractive in high-penetration areas (see text box on page 38 of the full report).
The full Utility-Scale Solar report, along with an accompanying summary slide deck, a data file, and a number of interactive data visualizations, can be found at utilityscalesolar.lbl.gov.

In addition, a free webinar summarizing key findings from the report will be held on Thursday, September 20 at 10 AM Pacific/1 PM Eastern.  Register for the webinar here.

For questions on the report, feel free to contact Mark Bolinger (MABolinger@lbl.gov or Joachim Seel (JSeel@lbl.gov) at Lawrence Berkeley National Laboratory.

Lawrence Berkeley Lab Electric Policy Markets Group https://emp.lbl.gov

Also see https://emp.lbl.gov/utility-scale-solar/ which points to the following
  • Installation and Technology Trends:  The use of solar trackers dominated 2017 installations with nearly 80% of all new capacity.  In a reflection of the ongoing geographic expansion of the market beyond California and the high-insolation Southwest, the median insolation level at newly built project sites declined again in 2017.  While new fixed-tilt projects are now seen predominantly in less-sunny regions, tracking projects are increasingly pushing into these same regions.  The median inverter loading ratio grew to 1.32 in 2017, allowing the inverters to operate closer to full capacity for a greater percentage of the day.
  • Installed Prices:  Median installed PV project prices have steadily fallen by two-thirds since the 2007-2009 period, to $2.0/WAC (or $1.6/WDC) for projects completed in 2017.  The lowest 20th percentile of projects within our 2017 sample were priced at or below $1.8/WAC, with the lowest-priced projects around $0.9/WAC.  Overall price dispersion across the entire sample has decreased steadily every year since 2013; similarly, price variation across regions decreased in 2017.
  • Operation and Maintenance (“O&M”) Costs:  PV O&M costs were in the neighborhood of $16/kWAC-year, or $8/MWh, in 2017. These numbers include only those costs incurred to directly operate and maintain the generating plant.

Saturday, September 15, 2018

Road makers turn to recycled plastic for tougher surfaces - On the plastic highway

OF ALL the plastic produced since the 1950s, less than 10% has been recycled. The vast majority ends up being dumped, most of it in landfill. Some is left to litter the natural environment, where it can get into rivers and wash out into the sea (see article). The plastic-waste problem will worsen before it gets better: some 380m tonnes of the stuff are likely to be made this year.... 

... Just as plastic is derived from petrochemicals, bitumen is produced as a by-product of refining oil. Both are polymers, which consist of long strands of molecules bound together firmly. It is this characteristic that makes plastic strong and contributes to its great longevity.... 

Recycled plastic is already used to make some products, such as guttering and sewage pipes.... On September 11th in Zwolle, a town in the Netherlands, a 30-metre bicycle track made from 70% recycled plastic and the rest from polypropylene was opened. It will be used to test a product called PlasticRoad, which is being developed by two Dutch firms—KWS, a road builder, and Wavin, a firm that makes plastic piping—in partnership with Total, a French oil-and-gas firm.
PlasticRoad is prefabricated in a factory as modular sections. The sections are then transported to the site and laid end to end on a suitable foundation, such as sand. Because these sections are hollow, internal channels can be incorporated into them for drainage, along with conduits for services such as gas and electricity.... These were fitted with sensors to measure things such as temperature, flexing and the flow of water through the drainage channels. A second pilot cycleway is being built in the nearby town of Giethoorn.

Smart roads, too
... Car parks and railway platforms could follow.... [Plastic road] could contain sensors for traffic monitoring. In time, the circuits in the plastic roads might extend to assisting autonomous vehicles and recharging electric cars wirelessly.

Prefabricated plastic roads should last two-to-three times longer than conventional roads and cost less, the companies claim, mainly because construction times would be reduced by almost two-thirds. Anti-slip surfaces could be incorporated...

An alternative method of using recycled plastic is to mix the material into hot bitumen when making asphalt. A road is about to be built this way on the campus of the University of California, San Diego, to test a number of specialist roadmaking plastics developed by MacRebur, a British firm. Each mix is produced from plastic that is not easily or cheaply recycled and so typically ends up in landfill....
...
The company’s plastic mixes have already been used in roads, car parks and airport runways in various parts of the world. One of the oldest projects is a stretch of road in Cumbria, in north-west Britain, which is extensively used by heavy lorries. This used to need resurfacing every six months or so, but with the addition of plastic it is still going strong after two years....

Cleaning and sorting plastic made out of multiple polymers can be relatively expensive, especially if it is used to make low-value products such as packaging. But using such plastic as a replacement for bitumen is cost-effective, claims Mr McCartney. As an example, he says that a tonne of bitumen might cost around £400 ($521) in Britain. A recycled-plastic additive for a standard road works out at £300-£350 a tonne. The additive would replace a proportion of the bitumen, so there are savings to be made. At present 5-10% of the bitumen is replaced by the additives, but this could be increased to 25%.
...
Australia is another country that is starting to recycle plastic into roads. Earlier this year a 300-metre stretch was completed in ... a suburb of Melbourne, using a substance called Plastiphalt.
...
Stuart Billing of Downer, a firm involved in constructing the road, said that the cost of using the recycled materials was comparable with building a road in the usual way. But the road is expected to last a lot longer and prove better at coping with heavy traffic.
...
FOR FULL STORY GO TO:
The Economist Newspaper https://www.economist.com
September 13, 2018

Wednesday, September 12, 2018

Testing for crowd out in social nudges: Evidence from a natural field experiment in the market for electricity

Abstract
This study considers the response of household electricity consumption to social nudges during peak load events. Our investigation considers two social nudges. The first targets conservation during peak load events, while the second promotes aggregate conservation. Using data from a natural field experiment with 42,100 households, we find that both social nudges reduce peak load electricity consumption by 2 to 4% when implemented in isolation and by nearly 7% when implemented in combination. These findings suggest an important role for social nudges in the regulation of electricity markets and a limited role for crowd out effects.
...
The first nudge, which we call the peak energy report (PER), targets household electricity consumption during peak load events that periodically occur when demand for electricity is high. The closest analog to the PER that has been studied is the nudge examined in ref. 16, which utilizes moral suasion instead of social comparison to promote conservation during peak load events. Efforts to curb peak load feature prominently in energy policy because there generally is a mismatch between wholesale and retail prices within and across days in the energy sector, and moving consumption temporally can have large effects on emissions and social welfare (17⇓–19). Studies targeting peak load typically focus on the consequences of price changes (20⇓–22). The second nudge, the home energy report (HER), targets aggregate household electricity consumption and has been studied widely (23⇓⇓⇓⇓⇓–29).

Conducted in Southern California during the summer of 2014, the experiment randomly assigned 42,100 households to receive either no communications, the HER, the PER, or both the HER and PER. Combining information on treatment assignment with more than 30 million observations of hourly household electricity consumption, we identify the conservation effect of each social nudge in isolation and in combination.
...
We find that receipt of the PER causes a 3.8% reduction in electricity consumption during a peak load event and receipt of the HER causes a 2.1% reduction. When received in combination, the two social nudges cause households to reduce their electricity consumption by 6.8%. To put these effects into perspective, the price of electricity would have to be increased by nearly 70% during peak load events to achieve the electricity savings of receiving both the HER and PER. Experimental variation in the price of electricity during peak load events finds an own-price elasticity of −0.1 (16, 20⇓–22). Thus, to achieve the same reductions in consumption caused by the isolated effect of the HER and PER, prices during peak load events would have to be raised by 20 to 40%. To achieve the reductions caused by the combined effect of the HER and PER, electricity prices would have to be increased by nearly 70%. Furthermore, these findings suggest that the effect of the PER is not crowded out when households are already assigned to receive the HER. While we make no claim that these estimates will generalize across locations and domains, they provide evidence on the dynamics of nudging to achieve multiple policy targets in the market for electricity.
Fig. 6.
(A) We plot the differences in the log of electricity use between each treatment group and the control group on the 3 d with peak load events. (B) We compare the difference between the control group and the HER+PER group with the summation of the individual differences between the control group and the HER group and PER group. Vertical lines indicate the peak hours from 1300 to 1800 hours.
Fig. 7.
Average treatment effects during peak hours (1300–1800 hours) from a regression of log electricity use on treatment indicators and controls for each hour in the sample, the HER deployment wave, and the medium used to communicate the PER. We plot the total treatment effects on the 3 d with peak load events in the summer of 2014. Bar labels represent the point estimates, and we report corresponding SEs in parentheses. We also test the hypothesis of no crowd out by comparing the treatment effect of the HER+PER group and a summation of the treatment effects of the HER group and the PER group. We report the difference and corresponding SE.


  • by Alec Brandona
  • John A. Lista
  • Robert D. Metcalfeb,1
  • Michael K. Pricec, and 
  • Florian Rundhammerd

    1. aDepartment of Economics, University of Chicago, Chicago, IL 60637;
    2. bQuestrom School of Business, Boston University, Boston, MA 02215;
    3. cDepartment of Economics, Finance, and Legal Studies, University of Alabama, Tuscaloosa, AL 35487;
    4. dDepartment of Economics, Georgia State University, Atlanta, GA 30302
    Edited by Catherine L. Kling, Iowa State University, Ames, IA
    http://www.pnas.org/content/early/2018/08/07/1802874115/tab-article-info
    Proceedings of the National Academy of Sciences (PNAS)
    PNAS published ahead of print August 13, 2018

    Saturday, September 8, 2018

    In 2015, peripheral devices consumed nearly as much electricity as televisions

    Results from EIA’s 2015 Residential Energy Consumption Survey (RECS) show that televisions and related peripheral devices—such as digital video recorders (DVRs), video game consoles, and streaming devices—consumed 7% of the electricity used in American homes in 2015 and cost $103 per home per year to operate. Peripheral device consumption accounted for slightly less than half of this electricity consumption, collectively using almost as much energy as televisions.

    average consumption of televisions and related equipment in U.S. homes

    The new RECS data also provide insights into the consumption of the most-used and second-most-used TV in a home. RECS asks respondents detailed questions about their two most-used televisions, such as how many hours they are turned on, the size of the display, and the type of screen. This information informs the models used to estimate television consumption.

    In homes with more than one TV, the most-used TV consumed more than twice as much electricity as the second-most used TV. In addition, energy consumption of the most-used TV was higher in homes that had more than one TV. In homes with more than one TV, the most-used TV tended to be larger and was turned on for more hours each day.

    The RECS end-use category of televisions and related equipment aggregates the electricity consumption of televisions—which are found in 97% of American homes—with the electricity consumption of seven types of peripheral devices. Many of these devices may perform multiple functions, such as cable or satellite boxes that include a DVR or video game consoles that can connect to internet streaming services.
    television peripherals in homes by device type
    Of the devices surveyed, DVD and Blu-ray players were the most common, present in 61% of homes. Cable or satellite boxes without DVR capabilities were the second-most common, found in half of all homes. Separate DVRs were the least common, present in only 7% of homes.

    The 2015 RECS was the first time the survey asked respondents about Internet streaming devices that allow users to view media from the Internet on their TV such as Roku and Apple TV; 29% of respondents reported having such a device. On average, homes with a television had a total of 3.9 peripheral devices, or 1.6 devices per TV.

    Although they may perform the same functions, some peripheral devices can be much more energy efficient than others. For instance, internet-enabled smart TVs are the most efficient way to stream media compared with streaming devices or game consoles being used for the same purpose, according to analysis by the Environmental Protection Agency’s ENERGY STAR program.

    Televisions and peripheral devices often consume energy even when they are not in active use. They draw power in standby mode, allowing them to receive a signal from a remote control, perform recording functions, and maintain internet connection.

    ENERGY STAR-certified televisions are on average 27% more energy efficient than televisions that are not certified. Features such as highly efficient lighting technologies, default brightness settings less than the maximum, and automatic brightness control make televisions more energy efficient. One of the requirements to be ENERGY STAR-certified is that a television must consume 3 watts or less when in standby mode.

    You can find more information on household energy consumption and expenditures in the RECS data tables and microdata file.

    Principal contributor: Maggie Woodward
    September 6, 2018


    Friday, September 7, 2018

    Bold Climate Action Could Deliver US$26 Trillion to 2030, Finds Global Commission

    A ... report released by the Global Commission on the Economy and Climate finds that we are significantly under-estimating the benefits of cleaner, climate-smart growth. Bold climate action could deliver at least US$26 trillion in economic benefits through to 2030, compared with business-as-usual.

    The Report finds that over the last decade there has been tremendous technological and market progress driving the shift to a new climate economy. There are real benefits to be seen in terms of new jobs, economic savings, competitiveness and market opportunities, and improved wellbeing for people worldwide. Momentum is building behind this shift by a wide range of cities, governments, businesses, investors and others around the world, but it is not yet fast enough.
    ...
    Unlocking the Inclusive Growth Story of the 21st Century is being presented to the United Nations Secretary-General António Guterres ... at a global launch at UN headquarters in New York City. The report arrives just one week before the Global Climate Action Summit in San Francisco..
    ...
    The Report highlights opportunities in five key economic systems – energy, cities, food and land use, water, and industry. It demonstrates that ambitious action across these systems could deliver net economic gains compared with business-as-usual and:
    • Generate over 65 million new low-carbon jobs in 2030, equivalent to today's entire workforces of the UK and Egypt combined. 
    • Avoid over 700,000 premature deaths from air pollution in 2030. 
    • Generate, through just subsidy reform and carbon pricing, an estimated US$2.8 trillion in government revenues per year in 2030 - equivalent to the total GDP of India today - funds that can be used to invest in other public priorities or reduce distorting taxes. 

    “We can now see that this new growth story embodies very powerful dynamics: innovation, learning-by-doing, and economies of scale. Further, it offers us the very attractive combination of cities where we can move, breathe, and be productive; sustainable infrastructure that is not only clean and efficient, but also withstands increasingly frequent and severe climate extremes; and ecosystems that are more productive, robust, and resilient,” said Lord Nicholas Stern, I G Patel Professor of Economics and Government at the LSE and Co-Chair of the Global Commission. “Current economic models fail to capture both the powerful dynamics and the very attractive qualities of new technologies and structures. Thus we know we are grossly underestimating the benefits of this new growth story. And further, it becomes ever more clear that the risks of the damage from climate change are immense and tipping points and irreversibilities getting ever closer.”

    The Global Commission calls on governments, business, and finance leaders to urgently prioritise actions on four fronts over the next 2-3 years:
    • Ramp up efforts on carbon  pricing and move to mandatory disclosure of cliamte-related financial risks; 
    • Accelerate investment in sustainable infrastructure; 
    • Harness the power of the private sector and unleash innovation; and 
    • Build a people-centred approach that shares the gains equitably and ensures that the transition is just. 

    ...

    [Other highlights include:

    Smarter urban development: More compact, connected, and coordinated cities are worth up to US$17 trillion in economic savings by 2050[1] 2 and will stimulate economic growth by improving access to jobs and housing. They can strengthen resilience to physical climate risks and could deliver up to 3.7 gigatons per year of CO2e savings over the next 15 years, just shy of the total emissions of the European Union (EU) today.
    Sustainable land use: The shift to more sustainable forms of agriculture combined with strong forest protection could deliver over US$2 trillion per year of economic benefits; generate millions of jobs, mainly in the developing world; improve food security including by reducing food loss and waste (a third of all food produced is lost or wasted along the food chain); and deliver over a third of the climate change solution.7 At the same time, restoration of natural capital, especially our forests, degraded lands, and coastal zones, will strengthen our defences and boost adaptation to climate impacts, from more extreme weather patterns to sea-level rise.
    Wise water management: Today, 2.1 billion live without readily available, safe water supplies at home, and 4.5 billion live without safely managed sanitation.8 Water will also be where climate change impacts will be felt most keenly. Water scarce regions, notably the Middle East, the Sahel, Central Africa, and East Asia could see gross domestic product (GDP) declines of as much as 6% by 2050 as a result of climate change, spurring migration and sparking conflict.9 There are enormous opportunities to curb these impacts by using water better, whether though deployment of improved technology (from drip irrigation to remote sensors to water-efficient crops), planning and governance, use of water prices with targeted support to the poor, or by investing in public infrastructure. Today, poorly managed and often under-priced water results in the over-use and misallocation of resources across the economy. Addressing the water-energy-food nexus will be critical, particularly in increasingly water-stressed regions.
    A circular industrial economy: From 1970 to 2010, annual global extraction of materials grew from almost 22 to 70 billion tonnes.10 Each year, at least eight million tonnes of plastics leak into the ocean, contributing to a major new challenge for the 21st Century.11 Microplastics have been discovered in 114 aquatic species, many of which end up in our dinners.12 This challenge, however, is not just a social or environmental issue; it is also economic. Today, 95% of plastic packaging material value—as much as US$120 billion annually—is lost after first use.13 Policies which encourage more circular, efficient use of materials (especially metals, petrochemicals and construction materials) could enhance global economic activity, as well as reduce waste and pollution. Shifting to a circular industrial economy, combined with increasing efficiency and electrification, including for hard-to-abate sectors and heavy transport, could decouple economic growth from material use and drive decarbonisation of industrial activities.
    Jobs: The Report also finds that taking ambitious climate action could generate over 65 million new low-carbon jobs in 2030, equivalent to today’s entire workforces of the UK and Egypt combined, as well as avoid over 700,000 premature deaths from air pollution compared with business-as-usual.
    Subsidy reform and carbon pricing alone could generate an estimated US$2.8 trillion in government revenues per year in 2030 – more than the total GDP of India today – much needed funds that can be used to invest in public priorities.

    Wednesday, August 29, 2018

    Study highlights urgent need to tackle fisheries management and climate change together - More fish, food and income possible if nations act now on climate and sustainable management

    A new study by EDF and leading scientists shows that tackling sustainable fisheries management and climate change together can result in significant increases of food, fish and economic activity, but nations need to act quickly to realize these gains.

    The study details how the world’s oceans have the potential to be significantly more plentiful than today even with climate change, provided good management practices are put in place and warming is held to no more than 2 degrees Celsius, according to the first-of-its kind study published today in the American Association for the Advancement of Sciences’ (AAAS) journal, Science Advances.

    The study shows that compared to today, estimated future global outcomes include a $14 billion USD increase in profits, 25 billion additional servings of seafood and 217 million more metric tons of fish in the sea—nearly a third more fish than exist today—, if we can meet the imperative of the Paris Climate Accord and ensure global temperatures don’t rise beyond 2 degrees Celsius. The study cautions, however, that these results depend on implementing fisheries management that addresses climate-driven changes in species productivity and geographical range distribution as well as limiting warming from emissions to that level. Inaction on fisheries management and climate change will mean net losses of fish as the planet’s population grows.

    A dozen leading scientists from institutions including the University of California at Santa Barbara (UCSB), Environmental Defense Fund (EDF), National Center for Ecological Analysis and Synthesis and Hokkaido University conducted the research. It is the first study to examine future fishery outcomes under both climate change projections and alternative management approaches, and demonstrates that our oceans can be highly productive for decades to come if we act now to put effective management practices in place.


    Fig. 5 Difference in harvest and biomass under the Full Adaptation strategy in 2100 relative to today for RCP 6.0.
    The bubble size corresponds to current MSY, and the colors indicate fishery category based on current biomass and fishing mortality rate relative to BMSY and FMSY, respectively. The fishery categories are defined as follows: Healthy (F/FMSY < 1, B/BMSY ≥ 1), Emerging (F/FMSY ≥ 1, B/BMSY ≥ 1), Recovering (F/FMSY < 1, B/BMSY < 1), and Overfished (F/FMSY ≥ 1, B/BMSY < 1). A transparent bubble indicates a decrease in maximum sustainable yield in 2100 relative to today, whereas a solid bubble indicates an increase (see fig. S2 for results under the other RCPs). MT, metric tons.
    ...
    [By 2100, the study shows that compared to today, estimated future outcomes include 25 billion additional servings of seafood].

    Hot Temperatures Decrease Worker Productivity, Economic Output - A new study finds hot weather may cause significant global economic losses because workers are less productive when it is warm. Air conditioning may not solve the problem.

    From Montreal, Canada to Mount Washington, New Hampshire, heat records are being broken this summer in places not accustomed to sweltering temperatures. Studies have found that unusually hot weather is linked to lower economic output in countries around the world. Although several factors—from poor crop yields to heat-related illnesses—probably share part of the blame, there is also a more fundamental variable at play: When we get hot, we find it difficult to work. 

    “Because human physiology is the same whether you live in India, the United States or anywhere else in the world, the connection between hot temperatures and lower productivity has fundamental implications for how we should think about the costs of climate change going forward,” says Anant Sudarshan, the South-Asia Director at the Energy Policy Institute at the University of Chicago.  

    In a new study, Sudarshan and his coauthors analyzed the productivity of workers in India, the world’s third largest economy. They looked at both labor-intensive and highly automated manufacturing processes. In the first category, they found that the productivity of workers engaged in cloth weaving or garment manufacturing dropped by as much as 4 percent per degree as temperatures rose above 27° Celsius (80.6° Fahrenheit). However, when studying workers in the steel industry who were operating in plants with highly automated production they found that productivity did not fall when it got hot outside. 
    Daytime view of a more-or-less cone-shaped peak, perhaps reaching two hundred feet above the surrounding terrain. It is sparsely covered in poor-looking shrubs and trees; it otherwise reveals only an aspect of heated naked rock. Assorted parti-coloured blocky concrete buildings reach down from its lower slopes to a temple tank in the near foreground, around which is arrayed the more rounded and ornate temple structures.
    Alwar, on the fringes of the Thar Desert, registered a temperature of 50.6 °C (123.1 °F), India's highest, until it was broken in May 2016 at Phalodi at 51.0 °C (123.8 °F), another town in the desert state of Rajasthan. https://en.wikipedia.org/wiki/Climate_of_India
    Heat did more than influence productivity at work. It also increased absenteeism. A one degree increase in the ten-day temperature average increased the probability that a worker would be absent by as much as 5 percent. Interestingly, this remained true even where the workplace used automation. Mechanization might reduce the effects of temperature on the shop floor, but may not solve the problem of employees missing work.

    Less productive workers mean a less productive business, and a less productive economy. To determine if the declines in worker productivity decreased the output of factories, Sudarshan and his colleagues looked at data from almost 70,000 plants across India. They found that the value of output declined by about 3 percent for every degree above the average temperature. This loss is large enough to explain the entire reduction in India’s economic output in hot years

    To adapt to hotter temperatures, businesses could install climate control measures such as air conditioning. Sudarshan and his coauthors collected data from a number of garment plants in the midst of a phased roll-out of shop floor cooling, providing the researchers with the opportunity to compare workers on the same day in nearby plants who did and did not have climate control. They found that workers in plants with climate control were more productive. But, the climate control measures didn’t remove absenteeism. 

    Tuesday, August 28, 2018

    Report Confirms Wind Technology Advancements Continue to Drive Down Wind Energy Prices - Key findings indicate wind energy prices at all-time lows as wind turbines grow larger

    Wind energy pricing remains attractive, according to an annual report released by the U.S. Department of Energy and prepared by Lawrence Berkeley National Laboratory (Berkeley Lab). At an average of around 2 cents per kilowatt-hour (kWh), prices offered by newly built wind projects in the United States are being driven lower by technology advancements and cost reductions.

    “Wind energy prices ­– ­particularly in the central United States, and supported by federal tax incentives – remain at all-time lows, with utilities and corporate buyers selecting wind as a low-cost option,” said Berkeley Lab Senior Scientist Ryan Wiser of the Electricity Markets & Policy Group.

    Key findings from the U.S. Department of Energy’s Wind Technologies Market Report include:

    Wind power capacity additions continued at a rapid pace in 2017. Nationwide, wind power capacity additions equaled 7,017 megawatts (MW) in 2017, with $11 billion invested in new plants. Wind power constituted 25 percent of all U.S. generation capacity additions in 2017. Wind energy contributed 6.3 percent of the nation’s electricity supply, more than 10 percent of total electricity generation in 14 states, and more than 30 percent in four of those states (Iowa, Kansas, Oklahoma, and South Dakota).

    Bigger turbines are enhancing wind project performance. The average generating capacity of newly installed wind turbines in the United States in 2017 was 2.32 MW, up 8 percent from the previous year and 224 percent since 1998-1999. The average rotor diameter in 2017 was 113 meters, a 4 percent increase over the previous year and a 135 percent boost over 1998-1999, while the average hub height in 2017 was 86 meters, up 4 percent from the previous year and 54 percent since 1998-1999. Permit applications to the Federal Aviation Administration suggest that still-taller turbines are on the way. Increased rotor diameters, in particular, have begun to dramatically increase wind project capacity factors. The average 2017 capacity factor among projects built from 2014 through 2016 was 42 percent, compared to an average of 31.5 percent among projects built from 2004 to 2011, and 23.5 percent among projects built from 1998 to 2001.

    Low wind turbine pricing continues to push down installed project costs. Wind turbine equipment prices have fallen to $750-$950/kilowatt (kW), and these declines are pushing down project-level costs. The average installed cost of wind projects in 2017 was $1,610/kW, down $795/kW from the peak in 2009 and 2010.
    Wind energy prices remain low. Lower installed project costs, along with improvements in capacity factors, are enabling aggressive wind power pricing. After topping out at 7 cents per kWh in 2009, the average levelized long-term price from wind power sales agreements has dropped to around 2 cents per kWh – though this nationwide average is dominated by projects that hail from the lowest-priced region, in the central United States. Recently signed wind energy contracts compare favorably to projections of the fuel costs of gas-fired generation. These low prices have spurred demand for wind energy from both traditional electric utilities and nonutility purchasers, such as corporations, universities, and municipalities.

    The domestic supply chain for wind equipment is diverse. Wind sector employment reached a new high of 105,500 full-time workers at the end of 2017. For wind projects recently installed in the United States, domestically manufactured content is highest for nacelle assembly (more than 90 percent), towers (70 to 90 percent), and blades and hubs (50 to 70 percent). It is much lower (less than 20 percent) for most components internal to the turbine. Although there have been a number of manufacturing plant closures over the last decade, each of the three largest turbine suppliers serving the U.S. market – Vestas, General Electric Co., and Siemens Gamesa – has one or more domestic manufacturing facilities in operation.

    The Department of Energy’s release on this study is available at energy.gov/windreport.

    Berkeley Lab www.lbl.gov
    Press Release dated August 23, 2018

    Friday, August 24, 2018

    Western Electric Co-ops Increasingly Able to Deliver Savings by Integrating Renewable Energy

    Case-study analysis finds Tri-State Generation and Transmission Association members can save $600 million through 2030 by transitioning to renewable energy technologies

    Declines in renewable energy pricing are creating opportunities for electric cooperatives in the U.S. Mountain West to deliver cost savings to their members, and simultaneously creating risks for those utilities that are slower to transition to these technologies, according to a new study from Rocky Mountain Institute (RMI).

    To illustrate the importance of this broad regional trend, RMI produced a case study of Tri-State Generation and Transmission Association, a nonprofit, member-owned cooperative utility that provides power to more than 1 million consumers in Colorado, Nebraska, New Mexico and Wyoming. RMI found that Tri-State’s customers could save over $600 million through 2030 if the co-op integrated more renewable energy resources into its supply mix rather than continuing to operate its fleet of legacy fossil-fuel power plants. Coal generation provided approximately half of Tri-State’s generation in 2017. Furthermore, the study found a transition to renewable energy as the primary source of electricity would mitigate the risks of member rate increases resulting from customer self-generation, exits and environmental policy changes by 30 to 60 percent.

    The results of the study are consistent with the broader market trends illustrated though publicly available contract prices for new renewable resources in the Mountain West region. In Colorado, Xcel Energy has proposed retiring significant coal capacity and generating 55 percent of its energy from wind and solar resources by 2026. This would likely result in a net customer cost savings, considering the highly competitive bids for wind and solar energy received in response to Xcel’s request for proposals. The long-term fixed prices for new wind and solar projects coming into service in the early 2020s, as analyzed in the Tri-State case study, beat the operating costs of many existing coal assets in the West, let alone the cost to build and operate new coal- or gas-fired plants there, the study found.

    By prioritizing utility-scale renewables and other emerging technologies such as demand response, efficiency and storage, Western cooperatives like Tri-State have the opportunity to embrace the reorientation of the region’s grid. They can also take advantage of low pricing for renewable generation—including pricing available via current tax incentives—without sacrificing reliability. And by working together to bid for and procure clean-energy technologies, Western co-ops can also guard against the potential economic and policy risks of rate increases and declining energy sales, while advancing economic development and job creation in their home communities, according to A Low-Cost Energy Future for Western Cooperatives.

    The estimated $600 million savings for Tri-State members can be realized through avoiding the operating expenses and fixed costs of its fossil-fueled power plants. Operating legacy assets like these in the West has contributed to rate increases for electricity customers in Colorado, Nebraska, New Mexico and Wyoming, where rates have risen by more than five times the national average between 2007 and 2016. This is owing to the relatively high expenses of the region’s coal fleet in comparison with the lower-cost sources of electricity that much of the nation is embracing, including renewables and natural gas, according to the study.

    RMI compared the cost of continuing to operate a typical coal plant at a historical run rate to the cost of retiring that facility and purchasing renewable energy and capacity at current market prices. The option that integrates more renewable energy resources would result in costs equivalent to about $32 per megawatt-hour (MWh), versus about $40 per MWh for the option that relies on the coal plant—a 20 percent reduction in operating costs, according to the analysis.
    “The rapid cost declines in renewable energy projects present utilities in the West with an unprecedented opportunity,” Mark Dyson, a principal at RMI and a coauthor of the report, said. “The falling costs of these technologies compared with the costs of fossil-fuel assets allow operators to deliver lower energy bills to their customers without sacrificing reliability, all while cutting emissions, reducing risk and supporting economic development in local communities. They deserve a hard look.”

    The A Low-Cost Energy Future for Western Cooperatives report can be found at: https://info.rmi.org/low-cost-energy-future-western-cooperatives

    Rocky Mountain Institute https://www.rmi.org
    Press Release dated August 23, 2018