Showing posts with label Meta-Analysis. Show all posts

Friday, June 9, 2023

Tree cover and property values in the United States: A national meta-analysis

Abstract
[A meta-analysis by Kent Kovacs, Grant West, David J. Nowak and Robert G. Haight] uses 21 hedonic property value studies and 157 unique observations to study the influence of tree cover on the value of homes in the United States. The authors construct elasticity estimates of the percentage change in home value for a 1% change in the percentage of tree cover around a home. Cluster weighted averages of the elasticities account for the housing market and the precision of the property price effects for tree cover on and off property and for three categories of tree cover density. Meta-regression models further control for the housing market and tree cover heterogeneity, the methodological techniques of the primary study, and publication bias. The Mundlak meta-regression model with controls for US regions has the lowest out-of-sample transfer error. The larger elasticity for off property tree cover than on property tree cover (unless tree density is 10% or lower) suggests that the property value of homes rises more if tree cover is not on land that homeowners are responsible for maintaining. The elasticity in neighborhoods with greater than 25% tree cover (0.013) is four times larger than the elasticity in neighborhoods with 0 to 10% tree cover (0.003).
...
Their Mundlak model 2 predicts an $8.88 increase in the value of a single-family home in the Midwest for an on-property increase in tree cover of 0.18%.6 Assuming that the single-family home is on a half-acre lot (21,780 ft2) with an average tree cover of 18% (3920 ft2) (Table 2), they find that a 1% increase in the percentage tree cover amounts to an increase of 39 ft2. Suppose that a 24-in. dbh green ash tree has a crown radius of 35 ft. and a crown area of 962 ft2. A 1% increase in tree cover is equivalent to 0.04 additional 24-in. green ash trees on the property (39/962 = 0.04). The increase in property value for one green ash tree on the property is $8.88/0.04 = $222. Their Mundlak model 2 also predicts a $76.2 increase in the value of a single-family home in the Midwest for a 0.18% increase in tree cover within a mile of the home. A circular area with 1-mile radius has 87.6 million ft2. Using the average tree cover of 18% (Table 2), they find that trees cover 15.8 million ft2, and a 1% increase in the percentage tree cover amounts to an increase of 158,000 ft2. Suppose again a 24-in. dbh green ash tree has a crown radius of 35 ft. and a crown area of 962 ft2. A 1% increase in tree cover is equivalent to 164 additional 24-in. dbh green ash trees within a mile of the home (158,000/962 = 164).
https://www.nature.org/en-us/what-we-do/our-priorities/build-healthy-cities/cities-stories/benefits-of-trees-forests/
What is the total value of a 1% increase in tree cover in a neighborhood? Here, [they] need to calculate the increase in value of all the homes in the neighborhood, and so [they] need an estimate of housing density. According to the 2019 US Census, there are 2,176 households per square mile in St. Paul, MN. If we assume the neighborhood is a circular mile in size, then there are 2176 * 3.14 = 6833 homes in the neighborhood (there are 3.14 mile2 in a circular mile). If each home benefits from the 1% increase in tree cover in the circular area, then the aggregate increase in property value is 6833 * $76.2 = $520,675, for the off-property component of the tree cover. In addition, the aggregate increase in property value is 164 * $222 = $36,408 for the on-property component of tree cover, again assuming the 1% increase in tree cover is composed of 164 24-in. dbh ash trees. Adding those two components, the total value of a 1% increase in tree cover in the circular mile area is $557,083 or $277 per acre of land.

by Kent Kovacs, Grant West, David J. Nowak and Robert G. Haight
Ecological Economics via Elsevier Science Direct www.Sciencedirect.com
Volume 197, July 2022, 107424

Tuesday, May 23, 2023

Sustainability transitions of contaminated sites: A global meta-analysis on economic effects of remediation behaviour

Abstract:
The worldwide diversity of contaminated sites, coupled with a scarcity of available land presents a challenge for urban spatial planning and, has led to an increasing political significance for brownfield conservation and reuse to achieve land resource sustainability. In this study, economic or the so-called ‘rebound effects’ of land regeneration are studied via a global meta-analysis on value fluctuation of surrounding property. To this end, a total of 91 observations from 28 HPM (hedonic pricing model) studies were synthesized to conduct a meta-analysis following a conditional random effects procedure. The empirical results indicate that, in line with expectations, the conservation and recycling of land resource indeed generate significant rebound in the implicit price of residential houses, especially for those located within 2 km of contaminated sites. Before land remediation and reuse, dwellings closest in distance to contaminated sites experience the greatest value loss. On average, the depreciation in property values within the first 1 km distance from a contaminated site is about 8.18%, significantly at the 1% level, while the corresponding adverse impact from 1 to 2 km distance is a 4.8% price premium significantly at the 5% level. The significance of the stigma or rebound effects depends on 12 attributes, in which, house age, location, floor area ratio (FAR), and central business district (CBD) variables have the largest impact of −37.38% to 37.5%. From a practical perspective, the findings of this meta-analysis: (1) help refine contributing parameters in HPM studies to evaluate environmental economics; and (2) provide meaningful decision-making support for cost-effective remediation and benefit maximization.
by Xiaonuo Li, Shiyi Yi, Andrew B. Cundy and Weiping Chen
Land Degradation & Development via Wiley Online https://onlinelibrary.wiley.com/journal/1099145x
Volume 33, Issue11; 15 July 2022; Pages 1775-1786

Monday, January 17, 2022

Systematic Variation in Waste Site Effects on Residential Property Values: A Meta-Regression Analysis and Benefit Transfer

Abstract:
This article presents a meta-analysis based on 727 estimates from 83 hedonic pricing studies to provide new insights on the effects of waste sites on residential property values. Relative to previous meta-analyses on this subject, estimates are corrected for publication bias and the ability of the meta-regression model to produce reliable benefit-transfer estimates is assessed. Proximity to severely contaminated waste sites has a supremely negative impact on residential property values, whereas on average the distance from non-hazardous waste sites has no effect. Correcting for publication bias has a sizeable impact, reducing the average effect size by up to 38%. Benefit-transfer errors based on the meta-regression model are fairly large and, in line with the broader literature, outperform simple value transfer when the underlying data sample is heterogeneous. 
...
The corrected average effect size translates into a 1.5% to 2.9% property value increase per mile of increased distance from a waste site for a house at a one-mile distance. These estimates are situated in the lower range of values produced by the previous literature. The results are generally robust across justifiable estimators, weighting schemes and the replacement of moderators.
...
The subsample analyses revealed distinct differences for severely contaminated sites on the NPL and non-hazardous waste sites. As non-hazardous waste sites do not reduce property values on average, they are not considered a disamenity in these average cases. By contrast, severely contaminated waste sites on the NPL clearly reduce residential property values on average, with an estimated mean effect size of 42.2%. 
...

by Marvin Schütt; Institute for Environmental, Resource and Spatial Economics, Kiel University, Wilhelm-Selig-Platz 1, 24118, Kiel, Germany
Environmental and Resource Economics via Springer
Volume 78, 2021; Pages 381–416; Published: 24 February 2021

Wednesday, March 1, 2017

What are Households Willing to Pay for Improved Water Access? Results from a Meta-Analysis

Abstract:
Although several factors contribute to low rates of access to improved water and sanitation in the developing world, it is especially important to understand and measure household demand for these services. One valuable source of information regarding demand is the growing empirical literature that has applied stated preference methods to estimate households' willingness to pay (WTP). Because it is difficult to generalize and support planning based on this scattered literature, we conduct a meta-analysis to take stock of the worldwide sample of household WTP for improved drinking water services. Using 171 WTP estimates drawn from 60 studies, we first describe this sample and then examine the potential factors that explain variation in WTP estimates. Our results suggest that households are willing to pay between approximately $3 and $30 per month for improvements in water access. Specifically, in line with economic theory and intuition, WTP is sensitive to scope (the magnitude of improvement in drinking water services), as well as household income, and stated-preference elicitation method. We demonstrate how our results can be used to predict household-level WTP for selected improvements in drinking water access in regions with low coverage, and find that private benefits exceed the cost of provision.
The LifeStraw is a genius new invention
http://www.sciencedirect.com/science/article/pii/S0921800916308953
by George L. Van Houtven 1, Subhrendu K. Pattanayak 2, Faraz Usmani 3, Jui-Chen Yang 4 formerly 1 
1. RTI International, Research Triangle Park, NC, USA
2. Sanford School of Public Policy, Duke University, Durham, NC, USA
3. Nicholas School of the Environment, Duke University, Durham, NC, USA
4. Pacific Economic Research, LLC, Bellevue, WA, USA
Ecological Economics via Elsevier Science Direct www.ScienceDirect.com
Volume 136; June, 2017; Pages 126–135; Available online 23 February 2017
Keywords: Meta-analysis; Water; Sanitation; Contingent valuation; Willingness to pay

Monday, June 13, 2016

The implicit value of tree cover in the U.S.: A meta-analysis of hedonic property value studies

Abstract
Trees in residential neighborhoods and communities provide benefits for homeowners that are capitalized into residential property values. In this paper, we collected data from hedonic property value studies and merged these data with ancillary spatial data describing forest and socio-economic characteristics surrounding each study area to conduct a meta-analysis of the impact of tree canopy cover on the value of residential properties. The meta-analysis suggests that property-level tree cover of about 30% and county-level tree cover of about 38% maximize the implicit price of tree cover in property values. Currently, tree cover in the original study areas was about 14%, on average, around or near study properties. The empirical results, therefore suggest under investment of tree cover on private property from the perspective of individual property owners and from a societal perspective. The findings also have implications for community forest programs regarding planting trees and protection of mature trees to address potential changes in tree abundance, species diversity and stand age due to development and climate change.
...
Summary statistics for the variables used in the estimation are reported in Table 2. These data indicate that 64% of the observations have positive implicit prices. Of the studies with positive implicit prices, the average implicit price for a 1% change in tree cover is $239, and the comparable figure for negative implicit prices is −$156. Values of the variable treecover for the positive implicit prices range from 0.1% to 61% and the comparable range for negative implicit prices is 0% to 40%.
Redwoods National Park, California. (Photo: Holly Hayes, ©Creative Commons)
Redwood National Park (Photo: Holly Hayes, ©Creative Commons)
http://pnwcirc.org/smaller-trees-less-biomass-found-in-california-forests/
by Shyamani D. Siriwardena 1, , Kevin J. Boyle 2, Thomas P. Holmes 3 and P. Eric Wiseman 41. Department of Forest Resources and Environmental Conservation, 313 Cheatham Hall (0324), Virginia Tech, Blacksburg, VA 24061, USA
2. Virginia Tech Program in Real Estate, 420 Bishop-Favrao Hall (0715), Virginia Tech, Blacksburg, USA
3. USDA Forest Service, Southern Research Station, Research Triangle Park, NC, USA
4. Department of Forest Resources and Environmental Conservation, Virginia Tech, Blacksburg, USA
Ecological Economics via Elsevier Science Direct www.ScienceDirect.com
Volume 128, August 2016, Pages 68–76

Tuesday, March 25, 2014

Estimation of the global impacts of aviation-related noise using an income-based approach

Highlights
• We conduct a meta-analysis of 63 hedonic pricing noise studies and develop an income-based model to assess aviation noise impacts.
• We derive a relationship between city-level personal income and the willingness to pay for one decibel of noise reduction.
• The income-based model can be used to perform cost-benefit analysis of aviation noise policies on a global scale.
• The capitalized monetary impacts of aviation noise in 2005 are estimated to be $23.8 billion around 181 airports worldwide.

Abstract:
Current practices for assessing the monetary impacts of aviation noise typically use hedonic pricing methods that estimate noise-induced property value depreciation. However, this approach requires detailed knowledge of local housing markets, which is not readily available at a fine resolution for most airport regions around the world. This paper proposes a new noise monetization method based on city-level personal income, which is often more widely available. Underlying the approach is a meta-analysis of 63 hedonic pricing studies from eight countries, conducted between 1970 and 2010, which is used to derive a general relationship between average city-level personal income and the Willingness to Pay for noise abatement. Applying the new model to income, noise, and population data for 181 airports worldwide, the global capitalized monetary impacts of commercial aviation noise in 2005 are estimated to be $23.8 billion, with a Net Present Value of $36.5 billion between 2005 and 2035 when a 3.5% discount rate is applied. Comparison with previous results based on real estate data yields a difference of −34.2% worldwide and −9.8% for the 95 US airports in the analysis. The main advantages of the income-based model are fewer data limitations and the relative ease of implementation compared to the hedonic pricing methods, making it suitable for assessing the monetary impacts of aviation noise reduction policies on a global scale.
http://www.stopstanstedexpansion.com/photos_hatfield_heath_noise_meeting.html
by Qinxian He 1,  Christoph Wollersheim 2, Maryalice Locke 3 and Ian Waitz 1
Transport Policy via Elsevier Science Direct www.ScienceDirect.com
Available online 21 March 2014; In Press, Corrected Proof
http://dx.doi.org/10.1016/j.tranpol.2014.02.020
Keywords: Aircraft noise; Hedonic pricing; Willingness to pay; Aviation noise impacts; Cost-benefit analysis

Saturday, January 25, 2014

A Meta-Analysis of Hedonic Studies to Assess the Property Value Effects of Low Impact Development

http://www.mdpi.com/2079-9276/3/1/31
Abstract: 
Stormwater runoff from urban areas is a significant source of water pollution in the United States. Many states are promoting low impact development (LID) practices, which provide a variety of direct and ancillary ecosystem services. We describe a meta-analysis designed to evaluate the property value benefits of LID practices that reduce impervious surfaces and increase vegetated areas in developments, and present an example application to a hypothetical land use scenario. From the many hedonic property valuation studies of the benefits of general open space, we identified 35 studies that valued open spaces that were similar in nature to the small, dispersed open spaces characteristic of LID. The meta-regression estimates the percent change in a home’s value for an observed percent change in open space within a specific radius of a parcel, based on changes expected to result from LID approaches that increase green spaces. Our results indicate that the design and characteristics of a project affect the magnitude of benefits, and that values decline with distance. More broadly, the meta-analysis shows percent change and proximity are robust determinants of household willingness to pay for aesthetic and other services associated with local availability of small, dispersed open spaces resulting from LID, but that values for other features, including type of vegetation and recreational use may be site-specific. Policymakers and developers could draw on our synthesis of site characteristics’ effects to maximize benefits from open space associated with LID....
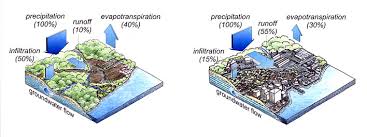
Besides loss of natural resource areas, habitat corridors, and buffers to wetlands and stream, conventional development (right hand graphic) creates large areas of impervious surfaces which prevent the infiltration of rainwater. Under natural (pre-development) conditions (left hand graphic), rain infiltrates through soils and percolates downward to the underlying water table, where it recharges the groundwater. Throughout the more permeable areas of Massachusetts approximately 50% of the annual precipitation infiltrates and recharges. Groundwater serves as drinking water supply and provides base flow to streams and wetlands. This base flow is critical to habitat quality for fish and other aquatic ecosystems. In many areas of eastern Massachusetts, where watersheds have become significantly urbanized with extensive impervious areas, the base flows of streams have been diminished. In some cases, such as the Ipswich River where the stream goes dry, eliminating habitat value. Surface runoff is also increased in urbanized watersheds creating greater peak flows which can cause flooding and channel erosion.-              http://www.mass.gov/envir/smart_growth_toolkit/pages/mod-lid.html 

Parking lot bioretention with rain garden -- http://tinyurl.com/ofgb5jz
From the many hedonic property valuation studies of the benefits of general open space, we identified 35 studies that value open spaces similar in nature to the small, dispersed open space characteristic of many LID practices. We estimate a meta-regression model (MRM) of the percent change in a home’s value for a given percent change in open space area within a specified radius of the parcel. Additionally, because our model is intended to be used for benefit transfer, following Boyle et al. [30], we examine various factors that indicate whether the estimates are robust or fragile....We reviewed over 180 studies, including nine stated preference studies, and over 100 hedonic studies of property value changes from improved amenities associated with, or similar to those achieved from LID practices.... The 35 studies provided 119 observations.... Studies examined variation in sales price based on variation in proximity to, adjacency to, or the surrounding amount of open space.... Differences include the specific type, size and features of open space valued, size of the surrounding area considered or distance to open space, population density of the study area, and geographic region.... We simply modeled an impervious cover reduction scenario that produced a 30% increase in vegetated open space (compared to conventional approaches) in most new developments.... The current home value in the ... watersheds with predicted new and re-development was $151,875, translating to an average annual rental value (at a 3% discount rate) of $4,556.... We calculated the total change in annualized property values by estimating the percentage change in rental-equivalent housing values in each buffer zone around each development project in each ... watershed and year, and then multiplying the predicted percent change in housing rental values by aggregate housing rental values.... The MRM is structured so that the marginal effect on property values of an increase in open space depends on the size of the change in open space and the distance from the open space. Based on the aggregate predictions of changes in housing values for each ... watershed and year, we then calculated the sum of the total present discounted value of the change in rental values in each HUC-12. This sum represents the projected benefits of using LID in that HUC-12, over the period of analysis (21 years). In this calculation, all future benefits were discounted back to 2013 dollars using a 3 percent discount rate and then annualized over 21 years.
...
Perceived mean increases in open space range from 1.3% to 3.7% per home across the 250 m and 250–500 m buffers. The use of LID without recreational amenities is expected to result in an annual increase of $30 and $10 in per-property mean rental value for houses in the 250 m and 250–500 m buffers, respectively. As expected, including recreational amenities in LID further enhances property values in the vicinity of the development project. For example, in the 250 m buffer, the expected increase in property values is 13% higher compared to the “no recreational amenity case” (i.e., $34 vs. $30). Although the mean per-watershed increase in property values is relatively modest, ranging from $3.9 to $10.5 thousand per year with and without recreation in the 250 m buffer (from $2.0 to $5.9 thousand per year in the 250–500 m buffer) the aggregate annualized benefits for the state of Illinois can be substantial and range from $31.0 to $36.0 million, without and with recreational benefits. We note that the estimated increase in property values represents a subset of environmental benefits associated with LID.
...
by Marisa J. Mazzotta 1,*, Elena Besedin 2 and Ann E. Speers 2
1 Atlantic Ecology Division, U.S. EPA Office of Research and Development, 27 Tarzwell Drive, Narragansett, RI 02882, USA; mazzotta.marisa@epa.gov; Tel.: +1-401-782-3026; Fax: +1-401-782-3030.
2 Abt Associates Inc., 55 Wheeler Street, Cambridge, MA 02138, USA; E-Mails: elena_besedin@abtassoc.com (E.B.); ann_speers@abtassoc.com (A.E.S.)
Resources www.mdpi.com/journal/resources
Volume 3; 2014; Pages 31-61; doi:10.3390/resources3010031
Received: 28 October 2013; in revised form: 24 December 2013 / Accepted: 7 January 2014 / Published: 21 January 2014

Tuesday, January 1, 2013

The value of reducing eutrophication in European marine areas — A Bayesian meta-analysis

Abstract: One of the threats to the marine environment is eutrophication, which causes many adverse impacts that reduce human well-being. Determining the benefits of improving the state of marine areas has drawn increasing attention, especially with the establishment of the European Union Marine Strategy Framework Directive. However, existing knowledge of the benefits provided by marine ecosystem services in Europe is limited and context-specific. This study applies meta-analysis to summarize available information on the value of reducing eutrophication in European sea areas, and to provide welfare predictions for different scenarios. The challenges related to the small number of available studies are addressed by employing a Bayesian meta-regression. Several models are compared with prior and posterior predictive checks, and value predictions are estimated using Bayesian model averaging. The results indicate that the perceived benefits of reducing eutrophication in European marine areas can be considerable, with the predicted annual willingness to pay per person ranging from $6 for small local changes to $235 for substantial changes covering large sea areas. The findings suggest that values differ between marine regions, highlighting the importance of investigating previously unstudied geographical areas. As marine policy requires international cooperation, future studies would also benefit from collaboration between countries.

Highlights

► Meta-analysis is used to summarize existing knowledge of the benefits of reducing eutrophication in Europe marine areas.
► Bayesian techniques are employed to address the challenges related to the small number of observations.
► Several models are compared with predictive performance checks and WTP predictions are done using Bayesian model averaging.
► The benefits of reducing eutrophication can be substantial, with the predicted WTP ranging from $6 to $235 per person. 
► Future valuation studies should be directed to previously unstudied geographical areas and international collaboration.
a MTT Agrifood Research Finland, Latokartanonkaari 9, 00790 Helsinki, Finland 
b Fisheries and Environmental Management Group, Department of Environmental Sciences, University of Helsinki, Finland
Ecological Economics via Elsevier Science Direct www.ScienceDirect.com
Volume 83; November, 2012; Pages 1–10
Keywords: Meta-analysis; Benefit transfer; Bayesian estimation; Eutrophication; Marine areas

Saturday, November 5, 2011

Identifying the scope effect on a meta-analysis of biodiversity valuation studies

http://www.sciencedirect.com/science/article/pii/S0928765511000194
Abstract: Insensitivity to scope is an issue of much debate in contingent valuation (CV) even today. Although the literature about insensitivity to scope is abundant, the reasons for it are not yet well known. Through a meta-analysis of CV studies of biodiversity, the treatment of the different possible measures of the quantity of the good is explored in relation to scope sensitivity. Overall, the findings suggest that CV results are sensitive to the amount of the good being valued, although the result depends on how the environmental change is measured. Results support the use of absolute sizes when conducting CV studies.

by Elena Ojea 1 and Maria L. Loureiro 2
1. Basque Centre for Climate Change (BC3), Alameda Urquijo 4, 4-1, 48008 Bilbao, Bizkaia, Spain
2. Universidade de Santiago de Compostela, Departamento de Fundamentos da Análise Económica, Facultade de Ciencias Económicas e Empresariais, Campus Universitario Norte, 15782 Santiago de Compostela, Spain
Resource and Energy Economics via Elsevier Science Direct www.ScienceDirect.com
Volume 33, Issue 3, September 2011, Pages 706-724
Keywords: Biodiversity; Contingent valuation; Ecosystems; Meta-analysis; Scope test