Showing posts with label Hydrofracking. Show all posts

Thursday, January 19, 2017

The Local Economic and Welfare Consequences of Hydraulic Fracturing

Exploiting geological variation within shale deposits and timing in the initiation of hydraulic fracturing, this paper finds that allowing fracking leads to sharp increases in oil and gas recovery and improvements in a wide set of economic indicators. At the same time, estimated willingness-to-pay (WTP) for the decrease in local amenities (e.g., crime and noise) is roughly equal to -$1,000 to -$1,600 per household annually (-1.9% to -3.1% of mean household in-come). Overall, we estimate that WTP for allowing fracking equals about $1,300 to $1,900 per household annually (2.5% to 3.7%), although there is substantial heterogeneity across shale regions.
...
Conclusions
Using a new identification strategy based on geological variation in shale deposits within shale plays, we estimate the effects of fracking on local communities. There are four primary findings. First, counties with high fracking potential produce roughly an additional $400 million of oil and natural gas annually three years after the discovery of successful fracking techniques, relative to other counties in the same shale play. Second, these counties experience marked increases in economic activity with gains in total income (4.4 - 6.9 percent), employment (3.6 - 5.4 percent), and salaries (7.6 - 13.0 percent). Further, local governments see substantial increases in revenues (15.5 percent) that are larger than the average increases in expenditures (12.9 percent) though the increased expenditures seem largely aimed at supporting the new economic activity, with little effect, for example, on per pupil expenditures in public schools. Third, there is evidence of deterioration in the quality of life or total amenities, perhaps most notably marginally significant estimates of higher violent crime rates, despite a 20 percent increase in public safety expenditures....
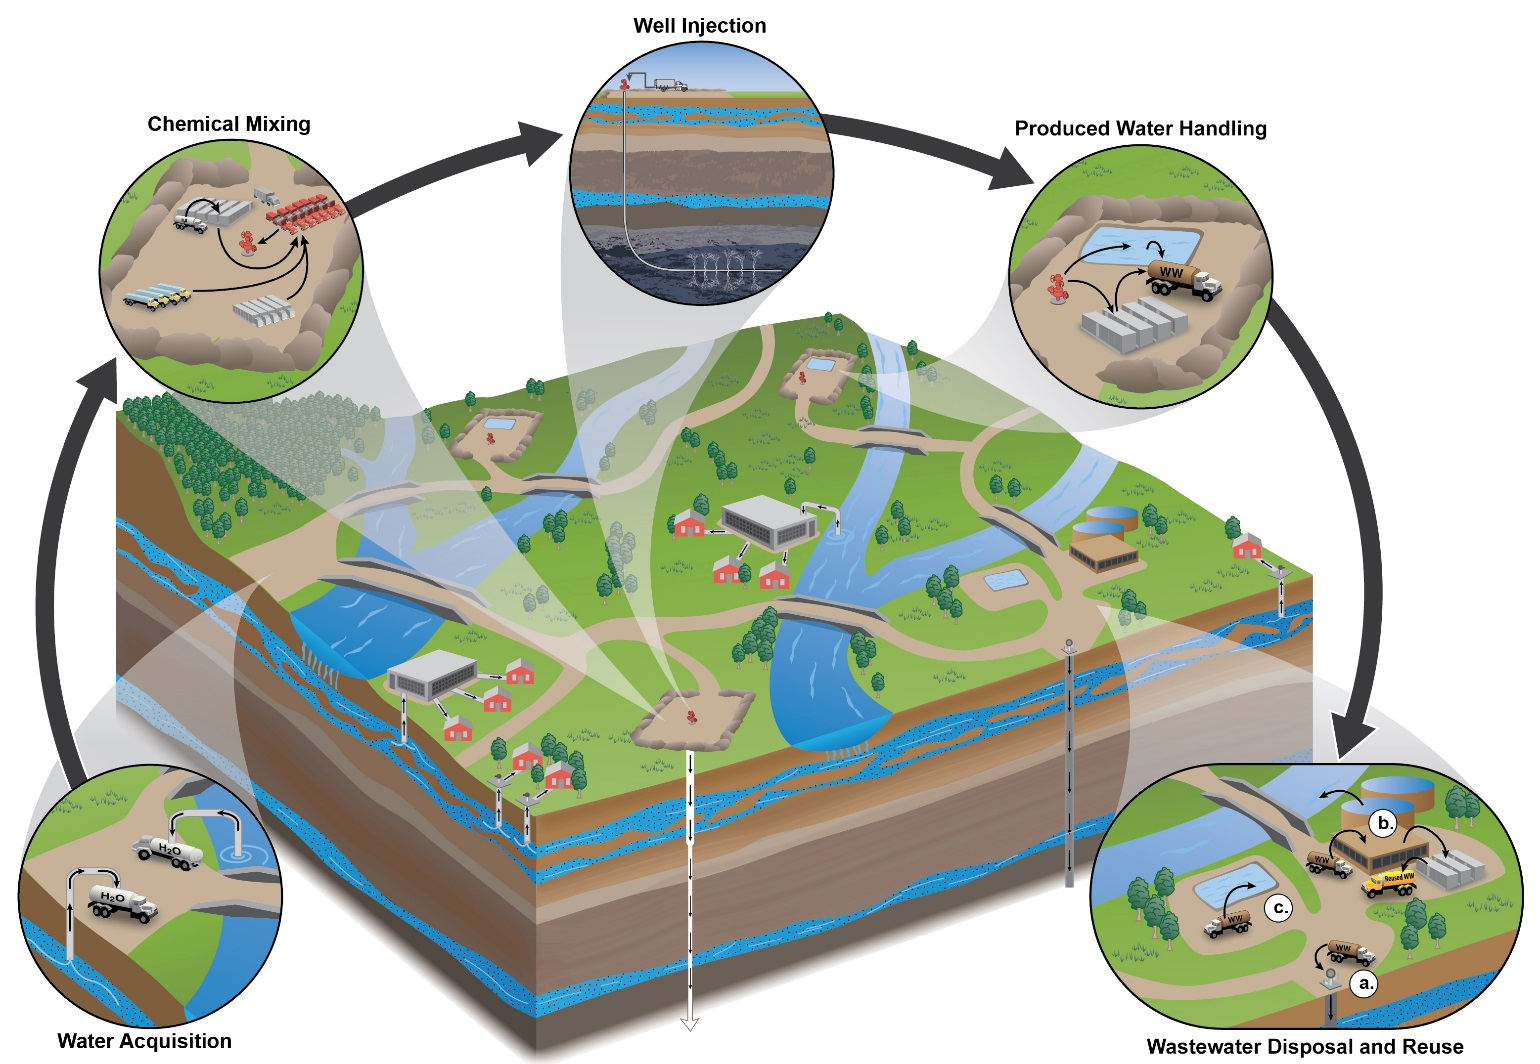
Image result for Hydrofracking epa
by Alexander W. Bartik, Janet Currie, Michael Greenstone and Christoper R. Knittel
The University of Chicago Becker Friedman Institute for Research in Economics
Working Paper 2016-29; December 21, 2016
Keywords: Public Policy, Environment, fracking, economic impact, economic growth

Sunday, January 8, 2017

Fracking, Drilling, and Asset Pricing: Estimating the Economic Benefits of the Shale Revolution

We quantify the effect of a significant technological innovation, shale oil development, on asset prices. Using stock returns on major news announcement days allows us to link aggregate stock price fluctuations to shale technology innovations. We exploit cross-sectional variation in industry portfolio returns on days of major shale oil-related news announcements to construct a shale mimicking portfolio. This portfolio can explain a significant amount of variation in aggregate stock market returns, but only during the time period of shale oil development, which begins in 2012. Our estimates imply that $3.5 trillion of the increase in aggregate U.S. equity market capitalization since 2012 can be explained by this mimicking portfolio. Similar portfolios based on major monetary policy announcements do not explain the positive market returns over this period. We also show that exposure to shale oil technology has significant explanatory power for the cross-section of employment growth rates of U.S. industries over this period.
gas well ohio
http://midwestenergynews.com/2015/10/26/analysis-shows-utica-shale-falling-short-of-projections/
by Erik Gilje, Robert Ready and Nikolai Roussanov
National Bureau of Economic Research (NBER) www.NBER.org
NBER Working Paper No. 22914; Issued in December 2016

Sunday, December 18, 2016

Fear of Fracking? The Impact of the Shale Gas Exploration on House Prices in Britain

Abstract:
Shale gas has grown to become a major new source of energy in countries around the globe. While its importance for energy supply is well recognized, there has also been public concern over potential risks such as damage to buildings and contamination of water supplies caused by geological disturbance from the hydraulic fracturing (‘fracking’) extraction process. Although commercial development has not yet taken place in the UK, licenses for drilling were issued in 2008 implying potential future development. This paper examines whether public fears about fracking are evident in changes in house prices in areas that have been licensed for shale gas exploration. Our estimates suggest differentiated effects. Licensing did not affect house prices but fracking the first well in 2011, which caused two minor earthquakes, did. We find a 2.7-4.1 percent house price decrease in the area where the earthquakes occurred. Robustness checks confirm our findings.

by Steve Gibbons, Stephan Heblich, Esther Lho and Christopher Timmins
National Bureau of Economic Research (NBER) www.NBER.org
NBER Working Paper No. 22859l Issued in November 2016

Tuesday, January 14, 2014

The Housing Market Impacts of Shale Gas Development

Abstract
Using data from New York and Pennsylvania and an array of empirical techniques to control for confounding factors, [the authors] recover hedonic estimates of property value impacts from shale gas development that vary with geographic scale and water source. Results indicate large negative impacts on nearby groundwater-dependent homes, while piped water-dependent homes are positively impacted by proximity (although by a smaller amount), suggesting an impact of lease payments. At a broader geographic scale, [they] find evidence that new wellbores can increase property values, but these effects diminish over time. Undrilled permits, conversely, may cause property values to decrease.
HydroFrac2.svg
Schematic depiction of hydraulic fracturing for shale gas
...
In 2000, shale gas accounted for 1.6 percent of total US natural gas production; this rose to 4.1 percent in 2005, and by 2010, it had reached 23.1 percent (Wang and Krupnick, 2013). Natural gas from the Marcellus formation currently accounts for the majority of this production (Rahm et al., 2013) and can be attributed to advances in hydraulic fracturing, horizontal drilling, and 3-D seismic imaging.
...
Upon signing their mineral rights to a gas company, landowners may receive two dollars to thousands
of dollars per acre as an upfront “bonus” payment, and then a 12.5 percent to 21 percent royalty per unit of gas extracted.
...
In all cases, the difference-in-differences (DD) estimate of the Groundwater Contamination Risk (GWCR) effect based on these estimates is negative. In the case of the 1.5km treatment buffer, the DD estimate is large (-16.7%) and significant at the 10% level.
...
The results ... imply that adding an extra well within 1.5 km causes groundwater homes to depreciate by 3.4%, (although an F-test reveals that the summation of these two effects has a t-stat of -0.7 and thus is not statistically significant at 1.5 km) with -10% being due to the risk of groundwater contamination, and +6.6% due to the positive impact of lease payments and other adjacency impacts. However, it is interesting to see how the effects differ as we change the size of the adjacency buffer. Very near the well (within 1 km), we see much larger negative impacts and insignificant positive impacts, where the summation of the two coefficients implies a statistically significant drop of 16.7% (t-stat of -4.19) for groundwater-dependent homes.
...
For groundwater-dependent (GW) homes, the negative impacts of adjacency are large when the property is very close (1.5 km or closer) to a shale gas well, and 37 become more negative the closer a home gets to a shale gas well. [The authors] find that the costs of groundwater contamination risk are large and significant (ranging from -10% to -22.4%), suggesting that there could be large gains to the housing market from regulations that reduce the risk. In the most recent year of our data (April 2011 to April 2012) the average annual loss for groundwater-dependent homes within 1.5 km of a well was $33,214.34 The average annual loss for GW properties is larger than the average annual gain for piped-water properties within 1.5 km of a shale gas well ($8,954).35 These losses, when multiplied by the number of affected houses, may be quite important in terms of property tax revenues for local governments, which could potentially justify costly regulation to diminish groundwater contamination risk. Furthermore, it is important to keep in mind that our estimates do not fully capture the total costs associated with groundwater contamination risk. Owners of groundwater-dependent homes may purchase expensive water filters to clean their drinking water when faced ith a shale gas well nearby; whole home filters can cost thousands of dollars 36. Since [they] do not capture adaptation costs, our estimates are therefore a lower bound of the actual costs incurred by homeowners located near shale gas wells, implying that contamination risk reduction can have very large benefits to nearby homes.