Monday, January 13, 2020

The Impacts of Harmful Algal Blooms and E. coli on Recreational Behavior in Lake Erie

Abstract:
This paper examines simultaneously the effect of E. coli and harmful algal blooms on recreational behavior using survey data collected from Ohio recreators who visited Lake Erie during the summer of 2016. Using simulation based on latent class models of recreation choice, we find beachgoers and recreational anglers would lose in aggregate $7.7 million and $69.1 million, respectively, each year if water quality conditions were to become so poor that Lake Erie’s western basin were closed. Finally, we recover heterogeneity in recreators’ aversion toward algae and Escherichia coli, with beachgoers more averse to E. coli and anglers more averse to algae.
Eerie Blooms in Lake Erie
https://earthobservatory.nasa.gov/images/145453/eerie-blooms-in-lake-erie
by David Wolf 1, Wei Chen 2, Sathya Gopalakrishnan 3, Timothy Haab 4 and H. Allen Klaiber 5
1. Assistant professor, Department of Economics, University of Wisconsin–Eau Claire; wolfdm@uwec.edu
2. Assistant professor, School of Agricultural Economics and Rural Development, Renmin University of China, Beijing, PR China; chen.4863@osu.edu
3. Associate professor, Department of Agricultural, Environmental, and Development Economics, The Ohio State University, Columbus; gopalakrishnan.27@osu.edu
Professor, Department of Agricultural, Environmental, and Development Economics, The Ohio State University, Columbus; haab.1@osu.edu
5, Professor, Department of Agricultural, Environmental, and Development Economics, The Ohio State University, Columbus; klaiber.16@osu.edu
http://le.uwpress.org/content/95/4/455.abstract
Land Economics http://le.uwpress.org/ via University of Wisconsin Press http://www.uwpress.org/
Volume 95, Number 4; November 1, 2019; pages 455-472

Do Public Benefits of Voluntary Cleanup Programs Justify Their Public Costs? Evidence from New York

Abstract:
This paper contributes to the debate over public benefits and costs of state-funded voluntary cleanup programs, using evidence from property values in New York City. We value site redevelopment separately from cleanup and examine time to capitalization. Using property fixed effects and controlling for time-varying shocks, New York’s Brownfield Cleanup Program added 4% to property values. Off-site gains averaged 5.6% for properties with three units or less and 1.2% for multifamily residences, producing a $579.3 million tax gain that does not exceed the $667.9 million in program spending. Benefits stem from program participation and cleanup, but not from site redevelopment. 
Clean soil stockpile
https://www1.nyc.gov/assets/oer/images/content/hero/IMG_3236_clean-soil-stockpile.JPG
by Olesya M. Savchenko 1 and John B. Braden 2
1. Assistant professor, Food and Resource Economics Department, University of Florida, Gainesville; savchenko.olesya@gmail.com
2. Professor Emeritus; Department of Agricultural and Consumer Economics, University of Illinois at Urbana-Champaign; jbb@illinois.edu
Land Economics http://le.uwpress.org/ via University of Wisconsin Press http://www.uwpress.org/
Volume 95, Number 3, August 1, 2019; pages 369-390

Investors Are Learning That Clean Tech Pays: The stock performance of green companies shows that climate change is also a business opportunity.

FOR FULL STORY GO TO:

The American companies most reliant on embracing green technology are outperforming every broad measure of the stock market, delivering a greater return last year than all but two (Russia and Greece) of the world’s 94 leading equity indexes.

These are the 92 publicly traded firms with at least 10% of their revenues derived from clean energy, energy efficiency or clean technology, according to data compiled by Bloomberg New Energy Finance. ...

The S&P 500 Index and Russell 3000 gained 31%. ... This exceptional result didn’t come close to the performance of the clean companies, with their combined total return (income plus appreciation) of 40%. Together they were worth $946 billion last year, more than triple their market capitalization at the end of 2010. Whether the investment period is 2, 5 or 10 years, the return is superior by margins of 12%, 37% and 112% for clean companies.

Total Return (Income plus appreciation)
  • ...
    The three biggest companies in this group by market capitalization all derived more than half their revenue from the clean-energy business. They are Nextera Energy Inc., ... operator of commercial nuclear power units and provider of electricity through wind, solar and natural gas; Tesla Inc. ..., manufacturer of battery-powered, electric vehicles; and Universal Display Corp., ... maker of organic light-emitting diode technology, according to data compiled by Bloomberg.

    ... The 19 energy firms in the group produced a 106% total return, 15 times the 7% gain by the overall energy-stock benchmark, the Russell 3000 energy sector. The nine technology companies among the 92 returned 70% when the Russell 3000 technology sector appreciated 46%, and the 16 BNEF-designated utilities earned 34% when the comparable Russell group advanced 26%, according to data compiled by Bloomberg.

    Even U.S.-imposed tariffs on products from China, which manufactures a ... [great deal] of clean-energy equipment, haven’t ... [hurt] the performance of the U.S. companies. Enphase Energy Inc., for example, moved its production to Mexico from China and the Petaluma, California-based maker of renewable energy equipment rallied 452% last year on revenue growth of 96%. Analyst estimates compiled by Bloomberg predict that Enphase sales will increase 26% and 27% annually through 2021.

    By contrast, revenues for the 28 companies in the S&P Energy Index, a mostly fossil-fuel crowd, declined 5% in 2019 and are forecast to grow 4% in each of the next two years.

    One investor who is bullish on clean companies ... manage[s] the most successful mutual fund in the U.S. last year, the Columbia Seligman Communication and Information Fund. The manager, Paul H. Wick, counted three of the cleaner companies among his winners: Advanced Energy Industries, Bloom Energy Corp. and Rambus Inc.

    Wick said that Bloom Energy, for example, reduced the cost of its products “on a continuous basis over the last four or five years” and “as a result will be cheaper than grid power in quite a few jurisdictions, states in the U.S. and overseas.” His fund returned 54% (income plus appreciation) in 2019 and Bloom Energy rallied 144% in the final two months of the year after Wick acquired its shares.

    Among the BNEF technology firms, Universal Display Corp., the ... provider of power-saving lighting products, appreciated 121% as sales climbed 64% last year amid forecasts for 23% and 25% growth in 2020 and 2021. That's a superior outlook compared to the 70 tech companies in the S&P 500 Information Technology Index, which saw sales increase 10% in 2019 with 10% projected for 2020 and 8% for 2021, according to analysts’ estimates.

    Renewable-energy utilities are similarly positioned for growth. Pattern Energy Group rallied 54% last year after the Canada Pension Plan Board agreed to acquire the San Francisco-based renewable power generation firm for $2.6 billion. Revenues increased 10% last year and are expected to rise 11% in 2020 and 3% in 2021, according to analyst estimates compiled by Bloomberg. The 28 companies in the S&P 500 Utility Index reported inferior sales growth of 6% last year and are likely to see only 3% in 2020 and 2% in 2021, according to the estimates.
    ...
    FOR FULL STORY GO TO:

    City to acquire streetlights, replace them with LEDs ... New lights projected to reduce energy consumption by 70% [in Warwick Rhode Island]

    "If all goes as planned, residents [of Warwick Rhode Island] won’t be waiting for weeks to have a burned-out streetlight replaced; they’ll have better roads, and best of all, the cost of borrowing all the money to get this done will be covered by all the savings."

    Key elements to the plan are city-owned LED streetlights that will save an estimated $750,000 now being paid to National Grid for the maintenance of an estimated 9,000 Warwick streetlights, plus additional energy savings, and a low-cost 10-year loan estimated at 1.3 percent for $10.2 million from the Rhode Island Infrastructure Bank. The loan would fund a ramped up three-year road replacement and paving program, while the savings from streetlights would cover loan debt costs.

    On Monday, the City Council gave second passages to ordinances authorizing the purchase of streetlights, conversion of fixtures to light-emitting diode (LED) technology and the financing of the project through an “appropriation obligation” bond not to exceed $3.2 million and the borrowing of the $10.2 million.....

    In preparation for the streetlight conversion that it is hoped can be completed by this time next year, the city has solicited bids for the acquisition and installation of a system as well as its maintenance. Eight bids have been received for maintenance of the system.... For the acquisition and installation of the system, the city received two bids... Among the issues to be considered in addition to price, equipment and timing are the capabilities of the system and whether they could generate additional savings and be of use to other departments.
    http://www.energy.ri.gov/efficiency/streetlights/
    With a basic system, photoelectric cells would control when the lights go on and off. However, there is ... technology to link the lights into a “mesh network” that would give the city the capability to turn on or off lights as well as control their output by neighborhoods. The cloud-based system would come at a higher cost and would require the installation of repeaters and gateways as well as a monthly fee. An alternative is a cell phone-based system where each light is independent of the other and doesn’t require repeaters or gateways. It would have the capability of incorporating cameras. Both systems would provide real-time data on the system identifying outages and allowing ... [regulation of] the output of light.

    The city is looking [at whether] ... the capability of reducing power and perhaps evening blacking some areas of the city during early morning hours could generate sufficient savings to more than offset added upfront costs and operational fees.

    According to Michael D’Amico, financial advisor for the city, the light management option would cost an additional $1 million and the network mesh an added $1.3 million from the basic dusk to dawn photocell system at $3.2 million. At this point he doesn’t see a cost benefit to going with either of the more interactive systems.

    With LEDs it is also easier to regulate the light shed so, for instance, sidewalks and streets can be lit without light spilling into abutting properties.

    As streetlights don’t have individual meters, there’s not a precise knowledge of the energy being consumed. The city now pays National Grid a “tariff” based on light wattage and estimated power usage over the year. In addition it pays a maintenance fee.

    It is estimated once the city replaces all the National Grid lights (it will buy those fixtures for a total cost of about $50,000) with LEDs energy consumption will be reduced by 70 percent.
    ...
    Since the city will own the lights, it will assume their maintenance. The [warranty] on the lights that have a projected life expectancy of 10 years would mean the city would have little or no maintenance issues in the first year.

    The cost of maintenance is being viewed as the major cost saving of the program with the potential of offsetting borrowing costs for the mayor’s road program.

    The projected savings of $775,000 would offset about half the debt service costs of both the $3.2 million and $10.2 million bonds, D’Amico said.... 

    When he announced the program, the mayor noted the historically low interest rates available as a common-sense and cost-effective way to address the city’s myriad infrastructure needs. The weighted interest rate for the bonds is expected to be 1.3 percent. Savings from the LED technology will significantly offset debt service costs. 
    ...
    The city would spread the repayment of the bonds over ten years.

    Furthermore, by contracting for the maintenance, the burden is not placed on the Department of Public Works and the city can dictate acceptable periods for the work to be completed. A maximum of five days is being considered for the replacement of a nonfunctioning light. Currently it can take several months to replace a streetlight.
    ...
    by John Howell
    "City to acquire streetlights, replace them with LEDs; $10.2 million for roads also planned"
    Warwick Online www.warewickonline.com
    Posted Thursday, January 9, 2020

    Sunday, January 12, 2020

    China's Unconventional Nationwide CO2 Emissions Trading System: The Wide-Ranging Impacts of an Implicit Output Subsidy

    China is planning to implement the largest CO2 emissions trading system in the world. To reduce emissions, the system will be a tradable performance standard (TPS), an emissions pricing mechanism that differs significantly from the emissions pricing instruments used in other countries, such as cap and trade (C&T) and a carbon tax. We employ matching analytically and numerically solved models to assess the cost-effectiveness and distributional impacts of China’s forthcoming TPS for achieving CO2 emissions reductions from the power sector.

    We find that the TPS’s implicit subsidy to electricity output has wide-ranging consequences for both cost-effectiveness and distribution. In terms of cost-effectiveness, the subsidy disadvantages the TPS relative to C&T by causing power plants to make less efficient use of output-reduction as a way of reducing emissions (indeed, it induces some generators to increase output) and by limiting the cost-reducing potential of allowance trading. In our central case simulations, TPS’s overall costs are about 47 percent higher than under C&T. At the same time, the TPS has distribution-related attractions. Through the use of multiple benchmarks (maximal emission-output ratios consistent with compliance), it can serve distributional objectives. And because it yields smaller increases in electricity prices than a comparable C&T system, it implies less international emissions leakage.
    https://chinapower.csis.org/china-greenhouse-gas-emissions/
    by Lawrence H. Goulder, Xianling Long, Jieyi Lu and Richard D. Morgenstern
    National Bureau of Economic Research (NBER) www.NBER.org
    NBER Working Paper No. 26537; Issued in December 2019

    Friday, January 10, 2020

    On the use of Hedonic Regression Models to Measure the Effect of Energy Efficiency on Residential Property Transaction Prices: Evidence for Portugal and Selected Data Issues

    Abstract
    Using a unique dataset containing information of around 256 thousand residential property sales, this paper discloses a clear sales premium for most energy-efficient dwellings, which is more pronounced for apartments (13%) than for houses (5 to 6%). Cross-country comparisons support the finding that energy efficiency price premiums are higher in the Portuguese residential market than in central and northern European markets. Results emphasize the relevance of data issues in hedonic regression models. They illustrate how the use of appraisal prices, explanatory variables with measurement errors, and the omission of variables associated with the quality of the properties, may seriously bias energy efficiency partial effect estimates. These findings provide valuable information not only to policymakers, but also to researchers interested in this area.
    https://inhabitat.com/energy-efficient-villa-in-portugal-uses-locally-sourced-cork-for-insulation/
    https://rem.rc.iseg.ulisboa.pt/wps/pdf/REM_WP_064_2019.pdf
    by Rui Evangelista 1, Esmeralda A. Ramalho ad Joao Anrade E. Silva 3
    1. Instituto Nacional de Estatística, rui.evangelista@ine.pt
    2. Universidade de Lisboa, Instituto Superior de Economia e Gestão & REM - CEMAPRE,
    eramalho@iseg.ulisboa.pt
    3. Universidade de Lisboa, Instituto Superior de Economia e Gestão & REM - CEMAPRE,
    joaoas@iseg.ulisboa.pt
    REM – Research in Economics and Mathematics
    REM Working Paper 064-2019; Lisbon, Portugal; January 2019

    Value of playgrounds relative to green spaces: Matching evidence from property prices in Australia

    Abstract
    We examine the effect on house prices of the presence of a small playground relative to an empty green space using a matching approach combined with hedonic regression analysis. Using a data set of 33,521 property sales in urban Australia, we match properties near small playgrounds to similar properties near two empty, open green spaces which are candidates for playground construction. We control for property characteristics and distance to a wide range of urban amenities and other open spaces. We find that the presence of a playground within 300 metres adds about AU$20,000 (4.6 per cent) to the average property price. The price effect of a playground is larger for houses than apartments and falls with distance from the playground.
    A Melbourne Natural Playground Named Australia’s Best Playground
    https://www.childrenandnature.org/2016/06/03/a-melbourne-natural-playground-named-australias-best-playground/
    Highlights
    • We assess the impact on property prices of the presence of a small playground.
    • We combine hedonic regression with a matching approach.
    • A small playground adds five per cent to the price of properties within 300 meters
    • Playgrounds add more to house prices than non-house property prices.
    • The price impact of playgrounds falls as distance to the playground increases.

    by Robert Breunig 1 Syed Hasan 2 KymWhiteoak 3
    1. Crawford School of Public Policy, Australian National University, Canberra, ACT 0200, Australia
    2. School of Economics and Finance, Massey University, Palmerston North, New Zealand
    3. RM Consulting Group Suite 1, 357 Camberwell Road, Camberwell, VIC 3124, Australia
    Landscape and Urban Planning via Elsevier Science Direct www.ScienceDirect.com
    Volume 190; October, 2019; 103608

    Urban trees, house price, and redevelopment pressure in Tampa, Florida

    Abstract
    We examined the relationship between urban trees and the sales price of single-family homes in Tampa, Florida. We chose Tampa, because the city is facing major redevelopment pressure that may impact the association between trees and house price. In particular, a frequently voiced view in Tampa’s development community is that trees adversely affect the value of houses that are being sold for redevelopment. We estimated hedonic models of sales price controlling for house and neighborhood characteristics and correcting for spatial autocorrelation (n = 1,924). We found that trees within 152m (500 feet) of a house’s lot were significantly associated with higher sales prices. Specifically, a 1-percentage point increase in tree-canopy cover was associated with a total increase in sales price of $9,271 to $9,836 (results were largely insensitive to correction for spatial autocorrelation). Our results demonstrate that, even in a city facing major redevelopment pressure, trees are associated with higher sales prices.

    Highlights
    • Trees on or right next to a house’s lot are not associated with higher sales price.
    • In contrast, houses with more neighborhood trees sell for a price premium.
    • Despite redevelopment pressure, trees are a neighborhood amenity.

     
    https://www.tampagov.net/sites/default/files/parks-and-recreation/files/purple_tab_bg.pdf
    by Geoffrey H. Donovan 1, Shawn Landry 2 and Cody Winter 3
    1. USDA Forest Service, PNW Research Station, 620 SW Main, Suite 502, Portland, OR, 97205, USA
    2. University of South Florida, School of Geosciences, 4202 E Fowler Ave., NES107, Tampa, FL, 33620, USA
    3. Environmental Protection Commission, 3629 Queen Palm Drive, Tampa, FL, 33619, USA
    Urban Forestry & Urban Greening via Elsevier Science Direct www.ScienceDirect.com
    Volume 38; February, 2019; Pages 330-336

    Wednesday, January 8, 2020

    Moral Hazard, Wildfires, and the Economic Incidence of Natural Disasters

    Abstract:
    This study measures the degree to which large public expenditures on wildfire protection subsidize development in harm's way. Using administrative firefighting data, we calculate geographically-differentiated implicit subsidies to homeowners throughout the western USA. We first examine how the presence of homes affects firefighting expenditures. These results are used to reconstruct the implied historical cost of protecting each home and to perform an actuarial calculation of expected future protection cost. The expected net present value of this subsidy can exceed 20% of a home's value. It increases with fire risk and decreases surprisingly steeply with development density. A simple model is used to explore effects on expansion of developed areas, density, and private risk-reducing investments. These results demonstrate how policy and institutions influence the costs imposed by a changing climate.
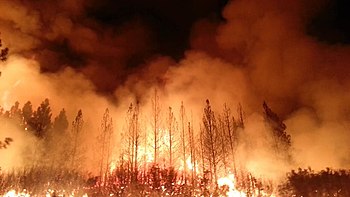
    The Rim Fire burned more than 250,000 acres (1,000 km2) of forest near Yosemite National Park, in 2013https://en.wikipedia.org/wiki/Wildfire
    ...
    During 1985–2017 total wildfire property damages in the United States were $51 billion, while direct firefighting costs for federal agencies alone totaled $43 billion.
    ...
    A sample of homes including all 8.6 million homes in the western US located near areas of wildland vegetation (44% of all western US residential homes, condos, and apartments)....The range of historical protection costs is large. The average net present value ranges from a few hundred dollars per home for the lowest-cost cells to almost $100,000 per home in the highest-cost cells.
    ...
    Using the “suppression only” measure, 50% of WUI homes have expected protection costs under $500, while the highest-risk homes have costs that are much larger. Five percent of homes have expected costs exceeding $3,800. One percent of homes have expected protection costs exceeding $12,700. Using the “suppression plus” measure results in higher costs. The 95th and 99th percentiles of this distribution are about twice as high as for the “suppression only” measure.
    ...
    In 2014, California began requiring homeowners in the Cal Fire protection area to pay an equal annual fee of about $150 per year. The fee proved unpopular among homeowners and was suspended in 2017. This study shows that such a fee would need to be much more geographically differentiated in order to correct incentives (as opposed to simply raising revenue). Another lesson from this study is that exempting owners of existing homes could increase the political acceptability of such a policy without reducing its effectiveness, since the protection costs we estimate are not generally high enough to justify abandonment of existing homes. An alternative would be to assign firefighting costs to local governments, which would recover them through property taxes or other measures. This approach would incentivize cities and counties to consider fire protection costs in zoning, land use, and building codes/


    https://www.nber.org/papers/w26550
    by Patrick Baylis and Judson Boomhower
    National Bureau of Economic Research (NBER) www.NBER.org
    NBER Working Paper No. 26550; Issued in December 2019

    The Private and External Costs of Germany's Nuclear Phase-Out

    Abstract:
    Many countries have phased out nuclear electricity production in response to concerns about nuclear waste and the risk of nuclear accidents. This paper examines the impact of the shutdown of roughly half of the nuclear production capacity in Germany after the Fukushima accident in 2011. We use hourly data on power plant operations and a novel machine learning framework to estimate how plants would have operated differently if the phase-out had not occurred. We find that the lost nuclear electricity production due to the phase-out was replaced primarily by coal-fired production and net electricity imports. The social cost of this shift from nuclear to coal is approximately 12 billion dollars per year. Over 70% of this cost comes from the increased mortality risk associated with exposure to the local air pollution emitted when burning fossil fuels. Even the largest estimates of the reduction in the costs associated with nuclear accident risk and waste disposal due to the phase-out are far smaller than 12 billion dollars.

    by Stephen Jarvis, Olivier Deschenes and Akshaya Jha
    National Bureau of Economic Research (NBER) www.NBER.org
    NBER Working Paper No. 26598; Issued in December 2019

    Looking Back at Fifty Years of the Clean Air Act - After major expansion in 1970, the Clean Air Act led to substantial emissions reductions and health improvements—as well as some unintended consequences.

    Abstract
    Since 1970, transportation, power generation, and manufacturing have dramatically transformed as air pollutant emissions fell significantly. To evaluate the causal impacts of the Clean Air Act on these changes, we synthesize and review retrospective analyses of air quality regulations. The geographic heterogeneity in regulatory stringency common to many regulations has important implications for emissions, public health, compliance costs, and employment. Cap-and-trade programs have delivered greater emission reductions at lower cost than conventional regulatory mandates, but policy practice has fallen short of the cost-effective ideal. Implementing regulations in imperfectly competitive markets have also influenced the Clean Air Act’s benefits and costs.
    • Spatially varying regulations can impose substantial costs on local economies.
    • Current applications of market-based mechanisms may fall short of cost-saving expectations.
    • Varying fuel content regulations across the United States may impose unnecessary costs on consumers in separated markets.
    • Regulatory flexibility for fuel content rules doesn’t always yield cost-effective results.
    • Unanticipated costs arising from overly optimistic technology projections are an important issue in the design of renewable fuel requirements.
    The SO2 program has been subject to extensive research, with a number of papers focusing on the early years (such as Carlson et al. 2000 and Ellerman et al. 2000) and some recent synthesis and review papers which combine ex-ante and ex-post papers (such as Schmalensee and Stavins 2013). The ex-ante analyses all suggest large cost savings based on a comparison of the least cost solution of achieving the cap to the command-and-control uniform performance standard case. Carlson et al. (2000) note that this cost reduction reflected dramatic declines in their estimated marginal abatement cost functions for sulfur dioxide emissions resulting from changes in technology and low-sulfur coal prices over 1985-1995.

    The only true ex post study of the program’s benefits and costs is by Chan et al. (2018), which finds much smaller cost savings than predicted ex ante. In part, this is the result of decisions of several power plants—in concert with their state public utility commissions—to install scrubbers rather than comply by purchasing allowances and/or using low sulfur coal, a decision that Chan et al. estimate increased annual compliance costs by nearly $100 million. Focusing on 2002 as a Phase II year before the transition to a period of regulatory uncertainty and using a mixed logit model of the firm’s compliance decision, the authors find that the SO2 program reduced compliance costs by about $200 million (1995$) and increased public health benefits by roughly $170 million. Chan et al. examine a performance standard that delivers the same aggregate emission outcome as the Acid Rain Program in 2002, which had much higher emissions than the cap due to use of banked allowances. Thus, the cost-savings of the two instruments may be smaller than they would have been under the statutory cap for 2002. Chan et al. also find that the prevailing pattern of allowance trading— from western generating units in sparsely populated areas to eastern generating units in more densely populated areas—increases public health damages by about $2 billion relative to a no-trade counterfactual.
    ...
    The Chan et al. paper builds on the insights in Muller and Mendelsohn (2009), which illustrated through an integrated assessment model how the location of an emission source relative to a downwind population could dramatically affect the monetized damages of a ton of sulfur dioxide emitted at that source. In their counterfactual analyses, Muller and Mendelsohn estimated that trading ratios, based on the relative damages associated with a ton of emissions for a pair of locations, could improve social welfare by nearly $1 billion per year compared to the ton-for-ton trading in the SO2 program as implemented. However, such differentiation in cap-and-trade implementation raises questions about administrative feasibility and accuracy in estimating ratios, especially in the presence of a complicated atmospheric chemistry that could induce negative ratios for NOx (Fraas and Lutter 2012). 
    ...
    While overall coal prices fell during the latter half of the 1990’s, Busse and Keohane found that delivered prices rose for plants covered by Phase I of the SO2 cap-and-trade program relative to those still operating under command-and-control regulation, and prices rose more at plants near a low-sulfur coal source. Overall, they estimate that railroads enjoyed an increase in annual producer surplus of more than $40 million, which represented about 15 percent of the economic surplus created by the cap-andtrade program....