Sunday, August 27, 2017

Brexit standards bonfire could mean £90 on electricity bills

Scrapping energy waste standards on domestic appliances and lightbulbs could add £90 to household electricity bills if less efficient Chinese products flood the UK market after Brexit.

Currently, British appliances are using energy ever more efficiently owing to progressively higher European Union standards – standards of which nearly nine in 10 Britons approve. However, there have been calls for the UK to scrap such standards when we leave the EU, allowing supposedly cheaper non-European models to come into the market. China would be the most likely source.

New analysis by the Energy and Climate Intelligence Unit (ECIU) of just seven best-selling appliances and light bulbs shows if all homes opted for less efficient models available on the Chinese market, annual electricity consumption would jump by around 3.5%. For comparison, EDF’s £20 billion-plus Hinkley Point C nuclear power plant will provide around 7% of the UK’s annual power demand.

Dr Jonathan Marshall, energy analyst at the Energy and Climate Intelligence Unit, said:
Once outside the EU, Britain will be able to set its own standards on the efficiency of our fridges and hoovers, but heeding calls to throw current standards on a regulation bonfire could leave UK homeowners with an unexpected hike on their bills. Behind the scenes, successive British governments have led the way in shaping these standards, driving industry to make innovative, less wasteful products and so saving UK bill payers cash. The proof is in the lightbulb which will now last for decades and cost as little as 98p thanks to LED technology.
Despite more electrical appliances in our homes, households are wasting less electricity with use having fallen to a level last seen before 1970. Higher fossil fuel prices over the past decade have driven up the price of energy, but £290 has been taken off the average dual fuel bill since 2008 thanks to Government energy efficiency measures and EU standards. Electricity consumed by old-style incandescent light bulbs has fallen by 97% as more efficient bulbs have replaced them.
...
Polling conducted by the National Federation of Women’s Institutes and the ECIU in 2015 found nearly nine out of ten (87%) British people support regulations to increase the energy efficiency of domestic appliances such as ovens and fridges, while a more recent 2017 survey of Conservative voters showed 85% were in favour of maintaining or improving energy efficiency of household devices.
...
From 1st September new EU standards will reduce the maximum wattage of vacuum cleaners to 900w. Which? provoked a media ‘storm’ around the introduction of a previous standard urging consumers to “buy now if you’re looking for a powerful vacuum cleaner” but a year and a half later concluded “energy use has dropped drastically…while the average cleaning performance on carpet has remained relatively stable over the same period.”

Despite generally becoming more efficient during this time, the upfront cost of appliances has also been falling with the price of a washing machine down by a quarter between 2004 and 2014.

An influential Select Committee of MPs has warned that the UK “could become a dumping ground for energy inefficient products” were formal standards to diverge from those in Europe [10].

The report, Made in China: importing higher energy bills, is available here.

Energy & Climate Intelligence Unit (ECIU) http://eciu.net
24 August 2017

Friday, August 25, 2017

National Renewable Energy Laboratory (NREL) Updates Baseline Cost and Performance Data for Electricity Generation Technologies

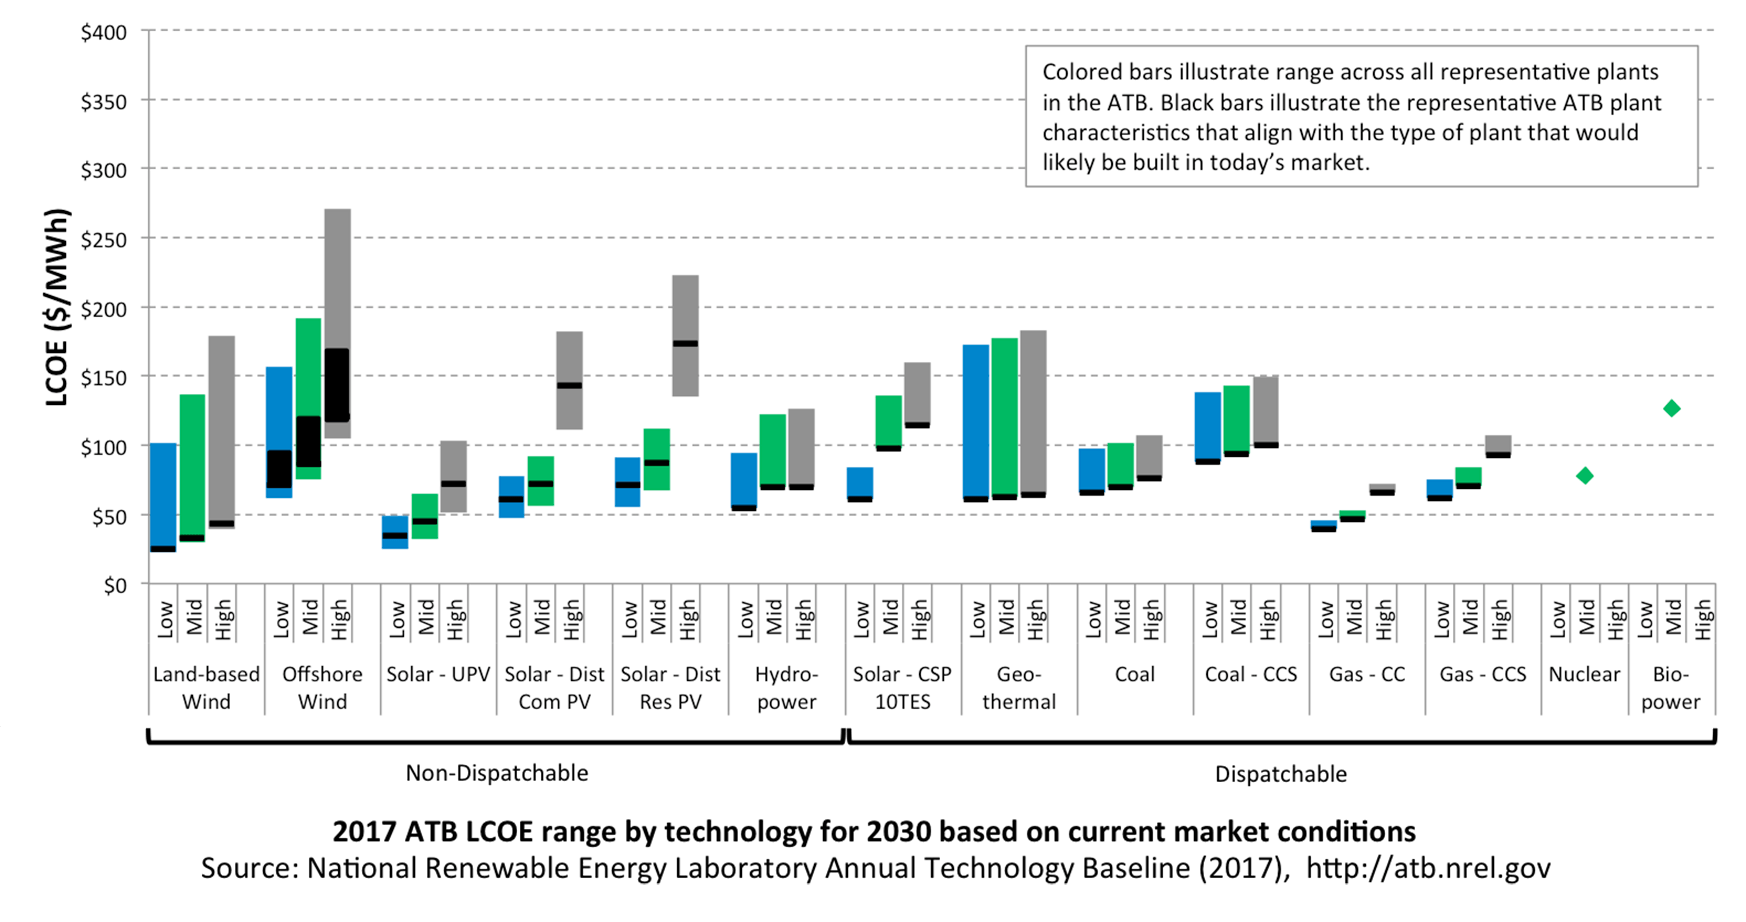
The Energy Department's National Renewable Energy Laboratory (NREL) has released the 2017 Annual Technology Baseline (ATB), updating a key source of reliable electricity generation technology cost and performance data used to support and inform electric sector analysis in the United States. Now in its third year, the ATB documents technology-specific information on a broad spectrum of electricity generation technologies, including wind, solar, geothermal, hydropower, biomass, coal, natural gas, and nuclear.
Graph titled 2017 ATB LCOE range by technology for 2030 based on current market conditions.
ATB LCOE range by technology for 2030 based on current market conditions.
Levelized cost of energy LCOE values calculated using macro-economic indicators (e.g., interest rates) estimated for 2017 in the U.S. Energy Information Administration’s Annual Energy Outlook 2017. The ATB focuses on electricity generation technology capital cost, operating costs, and energy production. It does not include time-varying macro-economic indicators. Values shown in 2015 U.S. dollars; hydropower is classified as non-dispatchable because most new hydropower generation would operate in run-of-river mode. LCOE captures the energy component of electric system planning and operation, but the electric system also requires capacity and flexibility services, typically associated with dispatchability, to operate reliably.

The ATB synthesizes current and projected data from various sources into a highly accessible and widely referenced resource for energy analysts. The 2017 ATB is available in a new interactive website at atb.nrel.gov and will be featured in a webinar on August 29.

“In addition to aggregating the most reliable, timely cost and performance data spanning the full range of energy technologies, the Annual Technology Baseline highlights key trends and makes projections out to 2050,” said NREL Senior Analyst Maureen Hand. “For energy analysts and others tasked with communicating relevant electricity technology cost and performance trends that have a bearing on energy markets, the ATB serves as an indispensable go-to resource that greatly facilitates and streamlines the work involved.”

For example, the ATB illustrates how solar photovoltaic (PV) capital costs have declined recently and are projected to continue to decline.  Similarly, land-based wind capital costs have fallen while capacity factors have increased. These are trends that are both projected to continue and make wind increasingly competitive with new generation from natural gas combined cycle plants in the near term.  The ATB provides three different levels of future technology cost and performance through 2050 to support analysis of future U.S. electric sector scenarios.

The ATB, which is supported by the Energy Department's Office of Energy Efficiency and Renewable Energy, incorporates NREL analysis, data from the U.S. Energy Information Administration, and information from a variety of published reports into two primary products for energy analysts. The Annual Technology Baseline spreadsheet documents detailed current and projected cost and performance data for electricity generation technologies. This year, a new interactive website describes each of the technologies and provides additional context for their treatment in the workbook. For each technology, the website provides:

  • Historical trends, current estimates, and future projections of three primary cost and performance factors: capital expenditures, capacity factor, and operations and maintenance cost
  • Documentation of the methodology and assumptions used to develop the projections of future cost and performance under high-, mid-, and low-cost cases
  • A calculated levelized cost of energy to illustrate the combined effect of the primary cost and performance factors.
The Annual Technology Baseline, which is supported by hundreds of literature citations, will be highlighted in a webinar on August 29, at 11 a.m.–1 p.m. MDT (1-3 p.m. EDT). Presenters will describe analytical products in detail, share examples of how they have been used, and provide an opportunity for attendees to ask questions. Register for the webinar at https://attendee.gotowebinar.com/register/4954393182456811522.

A Quarter of India’s Energy Demand Can Be Met with Renewable Energy - Increasing India’s renewables would save 12 times more than it costs

India can raise its renewable energy use to meet a quarter of the country's total final energy demand by 2030, according to the findings of a report presented today by the International Renewable Energy Agency (IRENA). Renewable energy prospects for India, a study from IRENA’s REmap programme, outlines action areas that can unlock India’s vast renewable energy potential, ensure clean and sustainable energy for generations to come, and enable the country to fulfill its pledges under the Paris Climate Agreement.

Renewable energy prospects for India describes how solar energy will play a vital role representing the second largest source of renewable energy use with 16 per cent, followed by wind at 14 per cent, and hydropower at 7 per cent of the country’s total final renewable energy use by 2030. Biofuels — which can be used across the end demand spectrum, such as for transport, electricity generation and heating — would account for 62 per cent. The country could potentially increase its share of renewable power generation to over one-third by 2030.

“With one of the world's largest and most ambitious renewable energy programmes, India is taking a leading role in the energy transformation both regionally and globally,” said IRENA Director-General Adnan Z. Amin. “India possesses a wealth of renewable resources, particularly for solar and bioenergy development, which can help meet growing energy demand, power economic growth and improve energy access, as well as boost overall energy security.”

Increasing renewable energy deployment could save the economy twelve times more than its costs by the year 2030, creating jobs, reducing carbon dioxide emissions, and ensuring cleaner air and water, with savings on health-related costs. Furthermore, the renewable energy technologies identified in the report would lower the demand for coal and oil products between 17 per cent and 23 per cent by 2030, compared to a business as usual scenario.
...
India has some of the world’s most competitive levelised costs of electricity (LCOE), even for wind, where the quality of the local resource is lower than in other regions. Financing costs, however, are somewhat higher than in neighbouring countries like China, and this has an impact on the LCOE. Figure 17 gives an overview of ranges and weighted averages for renewable power technologies commissioned or proposed between 2013 and 2015. Hydropower is still the lowest-cost renewable power generation option, with weighted average costs of between USD 0.04/kWh and USD 0.05/kWh for small- and large-scale projects, respectively. Large-scale wind projects have average costs of around USD 0.08/kWh, with a range between USD 0.045/kWh and USD 0.11/kWh, with small-scale

Friday, August 18, 2017

The climate and air-quality benefits of wind and solar power in the United States | Nature Energy

Abstract:
Wind and solar energy reduce combustion-based electricity generation and provide air-quality and greenhouse gas emission benefits. These benefits vary dramatically by region and over time. From 2007 to 2015, solar and wind power deployment increased rapidly while regulatory changes and fossil fuel price changes led to steep cuts in overall power-sector emissions. Here we evaluate how wind and solar climate and air-quality benefits evolved during this time period. We find cumulative wind and solar air-quality benefits of 2015 US$29.7–112.8 billion mostly from 3,000 to 12,700 avoided premature mortalities, and cumulative climate benefits of 2015 US$5.3–106.8 billion. The ranges span results across a suite of air-quality and health impact models and social cost of carbon estimates. We find that binding cap-and-trade pollutant markets may reduce these cumulative benefits by up to 16%. In 2015, based on central estimates, combined marginal benefits equal 7.3 ¢ kWh−1 (wind) and 4.0 ¢ kWh−1 (solar).

A free version of the paper dated January 2017 is currently available at https://emp.lbl.gov/sites/default/files/health_and_environmental_benefits_wind_solar_2007-2015_jan2017.pdf
by Dev Millstein, Ryan Wiser, Mark Bolinger & Galen Barbose
Nature Energy https://www.nature.com
Nature Energy 6, Article number: 17134 (2017); Published online: 14 August 2017

Indonesia Policy on Electricity-Generation Buildout in Java-Bali Means US$16 Billion in Unnecessary Coal Costs - Institute for Energy Economics

State-Owned Utility Would Pay an Estimated USD $76 billion Through Ill-Advised 25-Year Power Purchase Agreements

Halting planned expansion of coal power generation in Java-Bali could save the Indonesian Government USD$16.2 billion in unnecessary expenditure, according to a new report by the Institute for Energy Economics and Financial Analysis (IEEFA).

The report—“Overpaid and Underutilized: How Capacity Payments Could Lock Indonesia Into a High-Cost Electricity Future”—analyses Indonesia’s 2017-26 national energy plan and shows how long-term coal power contracts will require the country to pay for energy it is not using.

By contrast, a greater focus on renewable energy would likely result in multi-billion dollar savings.

“Indonesia’s rapid coal power expansion plan locks the country into decades of paying for power it isn’t using. It’s literally money for nothing,” said the report author, Yulanda Chung, an IEEFA energy finance consultant. “Capacity payment is used in the name of energy security, but simple changes can be made today that will save the Indonesian government billions of dollars.”

Indonesia’s state power authority, Perusahaan Listrik Negara (PLN), has stipulated that 24GW of coal-fired power and mine-mouth power generation capacity needs to be supplied by Independent Power Producers (IPPs) as part of the utility’s 2017-26 plan (Rencana Usaha Penyediaan Tenaga Listrik, RUPTL).


Aiming to attract power producers, PLN is offering 25-year power-purchase agreements (PPAs) by guaranteeing payment for all electricity produced, even if it is not actually used by consumers. In aggregate, PLN will pay an estimated USD $76 billion through 25-year PPAs.

The problem is most acute in Java-Bali, where IEEFA calculates current capacity, supplemented by renewable energy, is already sufficient to cover energy needs until 2026.

“There is no need to build new coal plants in Java-Bali when those that exist today are running at just over half-capacity,” said Chung.  “Rushing into new deals will lock in 25 years of paying for over 5GW of coal power supply which will remain idle.”
Friends of the Earth International http://www.foei.org http://tinyurl.com/yazubbp6
A further consequence of the country’s long-term gamble on coal is that it mitigates against the uptake of cheap renewable energy.

The levelized cost of electricity (LCOE) for solar in Indonesia is estimated at USD 17 cents/kWh in 2016. IEEFA conservatively forecasts solar PV becoming grid competitive at around USD 8 cents/kWh in 2021 in line with rapidly falling costs.

“Renewable energy is already cheaper than coal in multiple markets around the world,” Chung said. “Changes Indonesia can make today to its energy plan would see it benefit from this opportunity and avoid the fate of locking itself in to billions in excess expenditure on high cost coal.” 


IEEFA www.IEEFA.org conducts research and analyses on financial and economic issues related to energy and the environment. The Institute’s mission is to accelerate the transition to a diverse, sustainable and profitable energy economy.
Press Release dated August 10, 2017

Thursday, August 17, 2017

The future value of ecosystem services: Global scenarios and national implications

Highlights
• Global ecosystem services value can differ by $81 trillion/yr by 2050 by scenario.
• Land use change and management underlays our estimates.
• We provide global assessments and details for every country.
• Countries with deserts see the greatest effects.
• The Great Transition scenario can allow a sustainable and desirable future.

Abstract
We estimated the future value of ecosystem services in monetary units for 4 alternative global land use and management scenarios based on the Great Transition Initiative (GTI) scenarios to the year 2050. We used previous estimates of the per biome values of ecosystem services in 2011 as the basis for comparison. We mapped projected land-use for 16 biomes at 1 km2 resolution globally for each scenario. This, combined with differences in land management for each scenario, created estimates of global ecosystem services values that also allowed for examinations of individual countries. Results show that under different scenarios the global value of ecosystem services can decline by $51 trillion/yr or increase by USD $30 trillion/yr. In addition to the global values, we report totals for all countries and maps for a few example countries. Results show that adopting a set of policies similar to those required to achieve the UN Sustainable Development Goals, would greatly enhance ecosystem services, human wellbeing and sustainability.
Image result for earth
NASA
,,,
Putting the land areas and unit values together for each biome, the global total annual flow of ecosystem services values was estimated.... The total global values in both MF and FW were all lower than in 2011, dropping to USD $87.3 and $71.3 trillion/yr, respectively, from a 2011 value of USD $121.6 trillion/yr. The values in PR increased a small amount to USD $122.0 trillion/yr, mostly due to the fact that marine unit values did not change, forest and grassland/rangelands unit values decreased, and wetlands, croplands, and urban unit values increased. In the GT scenario, on the other hand, total global value increased to USD $152.3 trillion/year.
...
The total global annual ecosystem services values when the unit values are unchanged from those used in 2011 and only area extents are changed for each biome. MF and FW decreased to USD $97.0 (11% more than with unit value changes) and $89.1 (25% more than with unit value changes) trillion/yr from 2011 total values, respectively, when only the area was changed, keeping the unit values constant. Total PR values remained the same at USD $122 trillion/yr while GT total values increased to USD $127.0 trillion/yr (17% less than with unit value changes) when unit values were kept at 2011 levels. This comparison shows that using 2011 unit values creates a pattern similar to that when the unit values are changed for each scenario. The only difference is that the change to the total values for each scenario is reduced. This occurs because the changes in unit values amplify the existing changes in area cover of the biomes. Changes in biome areas produce significant changes in global ecosystem service values, regardless of unit values.

Study: We're Still Underestimating Battery Cost Improvements | Greentech Media

Batteries have been beating expectations in recent years as costs continue to fall.... Berkeley professor Daniel Kammen [has] devised a new model, recently published in Nature Energy ... predicting future cost declines at a pace faster than previous analyses. 

Scholars have modeled clean energy cost declines based on single factors, like annual production or cumulative production. These one-factor models approximate reductions from learning by doing: the more an industry deploys its product, the better it gets at it.  These models have a high explanatory value, but they didn’t see recent battery cost drops coming. They overestimate lithium-ion costs in the 2010-2015 period, the most recent years in the data set Kammen and his colleagues examined.

Their new model explains cost as the function of two variables, production volume and cumulative patents issued under the international Patent Cooperation Treaty.  When the researchers plugged in the latest battery production forecasts, with the assumption that patent activity continues at the average rate from the last five years in the dataset, they found ... lower cost reductions than existing forecasts in the literature.
At the battery pack level, lithium-ion needs to hit the $125 to $165 per kilowatt-hour range to compete with internal combustion engines (based on 2015 gas prices). The two-factor model predicts EV cost-competitiveness will arrive between 2017 and 2020, ... earlier than the previous[ predictions].

The model also covers solar with batteries. If the solar industry U.S. hits the Department of Energy SunShot goal of deploying PV for $1 per watt (which it has for large projects), residential solar-plus-storage will be widely competitive by 2020. The combination would offer a levelized cost of energy of $0.11 per kilowatt-hour.

That would transform residential storage from a niche item for powering wealthy homes during blackouts into a cost-effective investment for anyone who pays a lot for electricity.
...
In one test, the authors scaled down the rate of patent development by one-third. To still beat the energy storage cell cost of $100 per kilowatt-hour by 2020 in this scenario, the industry would need to deploy an additional 307 gigawatt-hours globally.

... Tesla’s Gigafactory aims to produce 35 gigawatt-hours, and it’s not yet completed. Deployment alone is not a practical way to achieve cost declines if scientific innovation drops off.

“At the most extreme case of no new innovation, the opportunity cost of meeting cost reduction targets through deployment alone would be extremely high, in exceedance of $140 billion through 2020,” the authors write. 
   
... The Trump administration has proposed sweeping budget cuts across the Department of Energy, which has traditionally spurred energy innovation through research funding.  Reports surfaced this week of impending layoffs on the order of 525 jobs at the national labs run by the DOE. Labs in that network performed groundbreaking early stage research that led to the commercialization of lithium-ion technology, and continue to break ground on the sort of next generation chemistries that could spur the “learning by innovation” described in Kammen’s model.  “Right when batteries are doing this great stuff, we’re seeing a trail-off in investment,” Kammen said. “We need the Department of Energy to step up, we need the private sector.”.  The DOE retains stronger support in Congress, which ultimately controls the budget.

Lithium-ion costs are following the path of solar, only faster.  “For the same amount of money invested and patents generated, batteries are equal to or ahead of where solar was,” Kammen said.

To keep up that pace, he added, it will be important to maintain a robust research ecosystem with many different labs, companies and universities competing for funds and patents. When money gets concentrated in a few monopolies, they tend to under-innovate.

It also helps that storage has an array of viable technologies, although lithium-ion has dominated the market thus far. This diversity bodes well for continued innovation.

FOR FULL STORY GO TO:
by Julian Spector 
by Julian Spector 
August 17, 2017

Abstract
The clean energy transition requires a co-evolution of innovation, investment, and deployment strategies for emerging energy storage technologies. A deeply decarbonized energy system research platform needs materials science advances in battery technology to overcome the intermittency challenges of wind and solar electricity. Simultaneously, policies designed to build market growth and innovation in battery storage may complement cost reductions across a suite of clean energy technologies. Further integration of R&D and deployment of new storage technologies paves a clear route toward cost-effective low-carbon electricity. Here we analyse deployment and innovation using a two-factor model that integrates the value of investment in materials innovation and technology deployment over time from an empirical dataset covering battery storage technology. Complementary advances in battery storage are of utmost importance to decarbonization alongside improvements in renewable electricity sources. We find and chart a viable path to dispatchable US$1 W−1 solar with US$100 kWh−1 battery storage that enables combinations of solar, wind, and storage to compete directly with fossil-based electricity options.

The economic value of ecosystem goods and services: The case of Mogale’s Gate Biodiversity Centre, South Africa

Highlights
• The most prominent ecosystem goods and services of MGBC is its contribution to water flow, climate regulation and grazing.
• Using direct market prices, the value of the services are US$1,65 million annually.
• The discounted value, after subtracting the management cost, of the services ranges between US$15,5 and US$41 million.
• The economic value of MGBC is between 25 and 67 times greater than the resource’s published capital value.

Abstract
Natural capital provides various ecosystem goods and services essential to the survival of mankind. In most cases, however, the markets for natural capital are incomplete. As a result, ecosystem goods and services are being enjoyed “freely”. Here we assess the economic value of the ecosystem goods and services of Mogale’s Gate Biodiversity Centre (MGBC) in South Africa using direct market values. We estimate the economic value of the natural capital stocks for game and carbon at approximately ZAR42 million (US$3 million) for 2015. As for the flows of ecosystem goods and services, the economic value was estimated to be approximately ZAR23 million (US$1,65 million) for 2015. Discounting these flow values into perpetuity and subtracting the discounted management cost yields the true economic value of the MGBC, which ranges between at least US$15,5 and US$41 million, depending on the discount rate used. This is between 25 and 67 times greater than the resource’s published capital value. It is this gross underrepresentation of the true value of natural capital that often leads to its destruction. It is strongly recommended that MGBC be represented by its true value in the integrated report of its owner and that it be managed accordingly.
Image result for mogale gate biodiversity centre
http://www.mogalesgate.co.za/
Ecosystem Services via Elsevier Science Direct www.ScienceDirect.com
Volume 26, Part A; August, 2017; Pages 127-136; Available online 29 June 2017.
Shepherd Mudavanhu 1. JamesBlignaut 2. NerineStegmann 4. Garth Barnes 4. Willem Prinsloo 5. Alistair Tuckett 5.
1. Department of Agriculture Economics, University of Stellenbosch, Stellenbosch, South Africa
2. Department of Economics, University of Pretoria, Pretoria, South Africa
3. South African Environmental Observation Network, Pretoria, South Africa
4. Department of Accountancy, University of Johannesburg, Johannesburg, South Africa
5 Mogale’s Gate Biodiversity Centre, Krugersdorp, South Africa
Keywords: Direct market valuation Economic value Ecosystem goods and services Natural capital

Friday, August 11, 2017

Voluntary Contributions to Hiking Trail Maintenance: Evidence From a Field Experiment in a National Park, Japan

Highlights
• We examine the effects of information provision on donation behavior.
• A field experiment was conducted to in Daisetsuzan National Park, Japan.
• Announcing seed money is superior to showing the amount of others' contribution.

Abstract
Donation is one of the most important solutions to inadequate funding for protected area management; however, there has been little agreement on the measures to be used to encourage visitors to donate. We conducted a field experiment in Daisetsuzan National Park, Japan, to examine the effect on donation behavior of providing information about two types of initial contributions. The first type of contribution is toward the fundraising campaign for trail maintenance and the initial amount of government funding (i.e., seed money) and information is provided about the target amount. The second type is for trail maintenance and information is provided on the value of one day's contribution by other participants. We found that announcing the seed money amount and the target significantly increased the probability of a positive contribution and raised the average contribution, compared with the control treatment of no additional announcements. When the participants knew others' contribution beforehand, the likelihood of a positive contribution increased; however, the average contribution tended to decrease. In conclusion, announcing the seed money and the fundraising target is superior to the other measures studied in this paper to raise funds in this specific context of protected area management.
...
With increased demand for biodiversity conservation and maintenance of ecosystem services, the coverage of protected areas expanded rapidly. By 2030, protected areas are likely to reach 15–29% of the surface area of the earth (Chape et al., 2005; Li et al., 2013 ;  McDonald and Boucher, 2011). However, most protected areas do not receive sufficient funding for their management, even though their value has been realized (Emerton et al., 2006). Although these insufficient situations are mostly reported in developing countries (Emerton et al., 2006), other countries also face the challenges of sustainable park management because of poor funding. For example, Olympic National Park in the U.S. needed $13.3 million to operate the park; however, only $7.8 million was available (NPCA, 2015). The Japanese national parks face the same problems, and the government declared a law in 2015 that allows local communities to collect an entrance fee to resolve these problems (Ministry of the Environmental, Japan, 2015). Especially, insufficient funding has significant impacts on the maintenance of trails, visitor centers, and other facilities, and leads to a lack of development of new protected areas even if the costs are relatively small. Although donation or voluntary contribution is one of the most important options to aid in sustainable management of protected areas (Emerton et al., 2006 ;  Thur, 2010), there is still much room to improve fund raising measures in most countries.
...
The surveys were conducted at the Numameguri Hiking Trail (NHT) in the Daisetsuzan National Park, Japan, in mid-September 2015. This is the largest Japanese terrestrial park, receiving approximately 5 million visitors per year (Ministry of the Environmental, Japan, 2016). Visitors are not charged any entrance fee. The NHT is one of the most popular hiking trails in the park because of the beautiful color of leaves in fall. However, visitors face a high risk of bear attacks; thus, they are requested to attend a lecture at an information center at the trailhead before hiking (for detail, see Kubo and Shoji, 2014). In addition, they need to be registered before hiking and are required to report their safety after hiking using a logbook. The NHT faced the risk of an insufficient management budget, especially due to reduced government funding over the last few years. A donation box at the information center was provided to cover the budget shortfall; however, it accumulated only a few thousand JPY1 per year until 2015 (personal communications with park staffs in July 2015). Thus, it was necessary for park authorities to find new measures to encourage park visitors to donate to the park management.
...
The questionnaires that participants in the PREV treatment received had the same information as the control treatment; however, participants were shown the amount that other participants had contributed during the first day of the experiment (40,088 JPY) by using a transparent box and bags, instead of a white box. Thus, participants were able to see a variety of contributions from 1 JPY coins to 1000 JPY notes.
...
Of the 934 participants, 707 participants positively donated and raised a total of 32,5045 JPY. In the control treatment, 67.5% of participants donated. Furthermore, the sample average contribution was 311.3 JPY and the average conditional contribution was 461 JPY. In the SEED treatment, the share and the sample average contribution significantly increased to 81.6% (F = 16.2, p = 0.00) and 396.7 JPY (z = − 3.66, p = 0.00), respectively. The conditional average contribution of the SEED treatment (486.1 JPY) was not statistically different from the control treatment, although it was higher than the control treatment. As for the SEED treatment, the share and the sample average contribution of the PREV treatment also significantly increased to 78.0% (F = 8.56, p = 0.00) and 336.3 JPY (z = − 2.14, p = 0.03), respectively. However, the average conditional contribution of the PREV treatment (431.4 JPY) was smaller than the control treatment, even though the difference was not statistically significant.
File:Daisetsusan national park 2005-08.JPG
https://en.wikipedia.org/wiki/Daisetsuzan_National_Park

Wednesday, August 9, 2017

Wind Technologies Market Report

Report Highlights
The U.S. Department of Energy (DOE)’s Wind Technologies Market Report provides an annual overview of trends in the U.S. wind power market. You can find the report, a presentation, and a data file on the Files tab, below. Additionally, several data visualizations are available in the Data Visualizations tab. Highlights of this year’s report include:

Wind power additions continued at a rapid clip in 2016: $13 billion was invested in new wind power plants in 2016. In 2016, wind energy contributed 5.6% of the nation’s electricity supply, more than 10% of total electricity generation in fourteen states, and 29% to 37% in three of those states—Iowa, South Dakota, and Kansas.

Bigger turbines are enhancing wind project performance: Increased blade lengths, in particular, have dramatically increased wind project capacity factors, one measure of project performance. For example, the average 2016 capacity factor among projects built in 2014 and 2015 was 42.6%, compared to an average of 32.1% among projects built from 2004 to 2011 and 25.4% among projects built from 1998 to 2001.

Low wind turbine pricing continues to push down installed project costs: Wind turbine prices have fallen from their highs in 2008, to $800–$1,100/kW. Overall, the average installed cost of wind projects in 2016 was $1,590/kW, down $780/kW from the peak in 2009 and 2010. 

Wind energy prices remain low: After topping out at nearly 7¢/kWh for power purchase agreements (PPAs) executed in 2009, the national average price of wind PPAs has dropped to around 2¢/kWh—though this nationwide average is dominated by projects that hail from the lowest-priced Interior region of the country (such as Texas, Iowa, Oklahoma). These prices, which are possible in part due to federal tax support, compare favorably to the projected future fuel costs of gas-fired generation. 
Installed Cost Of Wind Has Declined Since 2009-2010

The supply chain continued to adjust to swings in domestic demand for wind equipment: Wind sector employment reached a new high of more than 101,000 full-time workers at the end of 2016. For wind projects recently installed in the U.S., domestically manufactured content is highest for nacelle assembly (>90%), towers (65-80%), and blades and hubs (50-70%), but is much lower (<20%) for most components internal to the turbine.

Continued strong growth in wind capacity is anticipated in the near term: With federal tax incentives still available, though declining, various forecasts for the domestic market show expected wind power capacity additions averaging more than 9,000 MW/year from 2017 to 2020.

PDF icon Report PDF3.24

Lawrence Livermore Berkeley Lab Electricity Markets and Policy Group https://emp.lbl.gov

Tuesday, August 8, 2017

How Large Are Global Fossil Fuel Subsidies? - ScienceDirect

Highlights
• Fossil fuel subsidies are large, amounting to 6.5% of global GDP in 2015.
• Mispricing from a domestic perspective accounts for the bulk of the subsidy.
• Coal subsidies account for the largest part (about half) of global subsidies.
• In absolute terms, subsidies are highly concentrated in a few large countries.
• The environmental, fiscal, and welfare gains from subsidy reform are substantial.

Summary
This paper estimates fossil fuel subsidies and the economic and environmental benefits from reforming them, focusing mostly on a broad notion of subsidies arising when consumer prices are below supply costs plus environmental costs and general consumption taxes.  Estimated subsidies are $4.9 trillion worldwide in 2013 and $5.3 trillion in 2015 (6.5% of global GDP in both years). Undercharging for global warming accounts for 22% of the subsidy in 2013, air pollution 46%, broader vehicle externalities 13%, supply costs 11%, and general consumer taxes 8%. China was the biggest subsidizer in 2013 ($1.8 trillion), followed by the United States ($0.6 trillion), and Russia, the European Union, and India (each with about $0.3 trillion). Eliminating subsidies would have reduced global carbon emissions in 2013 by 21% and fossil fuel air pollution deaths 55%, while raising revenue of 4%, and social welfare by 2.2%, of global GDP. 

A version of this paper is available free of charge at https://www.imf.org/external/pubs/ft/wp/2015/wp15105.pdf

Volume 91, March 2017, Pages 11-27
David Coady 1, Ian Parry, LouisSears 2 and BaopingShang 1
1. International Monetary Fund, Washington, DC, USA
2. University of California, Davis, USA
Keywords: energy subsidies global warming air pollution efficient taxation deadweight loss revenue
ScienceDirect

Monday, August 7, 2017

A global framework for future costs and benefits of river-flood protection in urban areas : Nature Climate Change

Floods cause billions of dollars of damage each year, and flood risks are expected to increase due to socio-economic development, subsidence, and climate change. Implementing additional flood risk management measures can limit losses, protecting people and livelihoods. Whilst several models have been developed to assess global-scale river-flood risk, methods for evaluating flood risk management investments globally are lacking. Here, we present a framework for assessing costs and benefits of structural flood protection measures in urban areas around the world. We demonstrate its use under different assumptions of current and future climate change and socio-economic development. Under these assumptions, investments in dykes may be economically attractive for reducing risk in large parts of the world, but not everywhere. In some regions, economically efficient investments could reduce future flood risk below today’s levels, in spite of climate change and economic growth. We also demonstrate the sensitivity of the results to different assumptions and parameters. The framework can be used to identify regions where river-flood protection investments should be prioritized, or where other risk-reducing strategies should be emphasized.
...
In this study, we used Representative Concentration Pathways (RCPs) and Shared Socioeconomic pathways (SSPs)2 to represent future climate and changes in future socioeconomic conditions, respectively. In total, there are 4 RCPs and 5 SSPs, leading to a matrix of 20 combinations of projections.
...
For the ‘optimise’ objective, there is a large difference between the RCP/SSP combinations in both the benefits and the costs. The costs at the global scale range from USD 22 billion per year (RCP2.6/SSP3) and 78 billion USD per year (RCP8.5/SSP5). Averaged across all SSPs, the results show that the costs at the global scale increase as the CO2-equivalent concentration increases (RCP2.6 = USD 40 billion per year; RCP4.5 = USD 45 billion per year; RCP6.0 = USD 47 billion per year; RCP8.5 = USD 55 billion per year). This means that globally, higher greenhouse gas concentrations will lead to higher adaptation costs as a result of a generally larger increases in flood hazard (note that there are also areas where higher greenhouse gas emissions lead to reduction in flood risk). For all combinations of RCP/SSP, on average, the benefits far outweigh the costs, leading to B:C ratios ranging from 3.6 (RCP2.6/SSP3 and RCP4.5/SSP3) to 10.2 (RCP8.5/SSP5). The B:C ratios are also larger for the RCPs with higher CO2 concentrations, since the larger increase in hazard under those RCPs means that flood damage is higher, and therefore the potential avoided damage is also higher. Averaged across all RCPs, the costs at the global scale follow the projected increases in GDP to 2080 between the different SSPs (i.e. highest costs in SSP5 and lowest costs in SSP3, which are the SSPs with the highest and lowest global GDP growth respectively).

Under the ‘constant absolute risk’ objective, B:C ratios exceed 1 for all RCPs combined with SSPs. However, for SSP, which represents a more fragmented world, the B:C ratios are less than, because under this scenario, economic prospects are poor and thus the benefits of adaptation low. Under the ‘constant absolute risk’ objective’, B:C ratios exceed 1 for all combinations of RCPs and SSPs.

Percentage reduction in current expected annual damage for simulations carried out with assumed current protection standards compared to no flood protection
Percentage reduction in current expected annual damage for simulations carried out with assumed current protection standards compared to no flood protection.

B:C ratio at sub-national level, and percentage of models for which B:C ratio exceeds 1, for the EAD-constant and EAD/GDP-constant adaptation objections
B:C ratio at sub-national level, and percentage of models for which B:C ratio exceeds 1, for the EAD-constant and EAD/GDP-constant adaptation objections.

Protection standards at sub-national level in 2080 and associated B:C ratios
Protection standards at sub-national level in 2080 and associated B:C ratios.
http://www.nature.com/nclimate/journal/vaop/ncurrent/full/nclimate3350.html
by Philip J. Ward, Brenden Jongman, Jeroen C. J. H. Aerts, Paul D. Bates, Wouter J. W. Botzen, Andres Diaz Loaiza, Stephane Hallegatte, Jarl M. Kind, Jaap Kwadijk, Paolo Scussolini & Hessel C. Winsemius
Nature Climate Change http://www.nature.com
Published online 31 July 2017

Optimization of a vertical axis wind turbine for application in an urban/suburban area: Journal of Renewable and Sustainable Energy

Abstract:
The goal of this study is to investigate the effect of various design parameters on the performance of a Vertical Axis Wind Turbine (VAWT) subjected to realistic unsteady wind conditions. Thirteen turbine design configurations are examined to determine if an optimal VAWT has applications in an urban/suburban environment. The four design parameters of interest include the height-to-diameter aspect ratio ..., blade airfoil shape ..., turbine solidity ... and turbine moment of inertia. The height and diameter of the turbine varied between 1.89 and 2.54 m, depending on the aspect ratio.... The energy generated by each VAWT design configuration is simulated using a full year of actual wind speed data collected in 2009 at 9 different locations around Oklahoma City spanning an area of approximately 500 km2. The wind data were acquired from the top of traffic light posts at a height of about 9 m above the ground. In all cases, an active control strategy is used that allows the turbine to continuously adjust its rotational speed in response to the fluctuating wind. The results suggest that, for the case of operation in unsteady winds, the optimal power coefficient (Cp) versus tip speed ratio curve is not necessarily the one exhibiting the highest peak Cp value but rather the broadest shape. Of the thirteen configurations examined, the optimal wind turbine design capable of harvesting the most energy from the gusty winds was found to have an aspect ratio of H/D=1.2H/D=1.2, a solidity of S=12%S=12%, and a blade shape using the NACA 0015 airfoil. This design also displayed the lowest moment of inertia. However, when the effects of mass were removed, this design still performed the best. The site-to-site variation in terms of energy captured relative to the available energy in the gusty winds was only about 5% on average and increased slightly with turbine moment of inertia. Four of the suburban sites studied were deemed to be economically viable locations for a small-scale VAWT. The results further indicate that, at one of these sites, the levelized cost of energy associated with the top performing turbine designs examined in the study was about 10% less than the national electricity price, meaning that wind energy provides a cheaper alternative to fossil fuel at this location. It is surmised that VAWTs could economically harvest wind energy in the urban center as well if the turbines were located higher than 9 m, such as on the rooftops of commercial/residential buildings.
File:Vertical-axis wind turbine at Hartnell College Alisal Campus.gk.webm
by Lam Nguyen and Meredith Metzger; Department of Mechanical Engineering, University of Utah, Salt Lake City, Utah 84112, USA
Journal of Renewable and Sustainable Energy
Volume 9, Number 4; Published Online: August 2017
Journal of Renewable and Sustainable Energy 9, 043302 (2017); doi:
via "Vertical Axis Wind Turbines Can Offer Cheaper Electricity For Urban And Suburban Areas"

Full steam ahead for new power plant at Portsmouth Naval Base | BAE Systems | International

The CHP facility will reduce the naval base's carbon footprint.

BAE Systems is beginning work to install a specialist Combined Heat and Power (CHP) plant at Portsmouth Naval Base which will recycle energy, reduce carbon footprint and save the Ministry of Defence up to £4million per year in energy costs.

Energy and electrical requirements at the naval base are set to increase when the Queen Elizabeth Class aircraft carriers arrive in their home port. As part of BAE Systems’ ongoing commitment to Portsmouth, developing a dedicated CHP facility will not only meet this demand but also increase energy efficiency across the site.

Chris Courtaux, Head of Engineering and Energy Services at BAE Systems, said: “By developing this new facility we will be able to recycle energy consumption on the naval base as well as deliver a significant cost saving. This is an innovative solution to support the largest warships ever built for the Royal Navy.
... 
A CHP system produces electricity and heat from a single fuel source and is able to retain excess heat which would have otherwise be wasted. To create this new facility a former boiler house will be converted into and is due to be completed by the end of 2018.
Portsmouth Naval Base 
The £12million contract for the CHP facility forms an amendment to the Maritime Services Delivery Framework (MSDF) contract, awarded to BAE Systems by the Ministry of Defence in 2014. Under the MSDF contract, BAE Systems manages Portsmouth Naval Base on behalf of the Royal Navy, as well as supporting half of the Royal Navy's surface fleet on UK and global operations.
The CHP facility will reduce the naval base's carbon footprint.
...
Press Release dated August 4, 2017

which reports higher savings

Saturday, August 5, 2017

The Price of Climate Deregulation: Adding Up the Costs and Benefits of Federal Greenhouse Gas Emission Standards

Federal climate regulations are currently under attack, in part due to the perception that these regulations will impose excessive costs on regulated industries and society as a whole. But according to federal projections, the benefits of these regulations would significantly outweigh the costs. In a new paper, we added up the projected economic impacts of major federal rules aimed at reducing greenhouse gas emissions and found that the net benefits could reach nearly $300 billion per year by 2030. The rules will also generate a variety of non-monetized benefits, such as improved public health outcomes and the creation of jobs, as well as climate mitigation benefits that will extend well beyond 2030.

Jessica Wentz and Nadra Rahman analyzed the projected economic impacts of major regulations aimed at controlling carbon dioxide and methane: U.S. EPA’s Clean Power Plan, the Bureau of Land Management’s Methane and Waste Prevention Rule, EPA’s 2016 New Source Performance Standards for the oil and gas sector, and EPA’s emissions standards for both light-duty and heavy-duty vehicles.

Rahman and Wentz primarily aggregated EPA and Interior’s own cost-benefit projections of the Obama-era regulations. They also compared the values to separate cost-benefit analyses developed by independent researchers, a number of whom challenged the agencies’ analyses of the regulations, alternately stating that EPA and BLM had overestimated benefits or underestimated costs.
The $370 billion in gross benefits includes the positive impacts of reducing 980 million metric tons of carbon dioxide equivalent by 2030, along with the health benefits of also reducing other pollutants, such as nitrogen oxides.

These benefits would be four times greater than the projected $84 billion in total costs of implementing major regulations crafted under the Obama administration, said researchers in a paper published on the center’s website yesterday.

On a year-to-year basis, the economic benefits can either significantly exceed, or at the very least match, the cost of implementation. Some of the highest potential benefits come from implementing the Clean Power Plan and from standards for medium- to heavy-duty vehicles. The total does not include other benefits like job creation and long-term climate change mitigation benefits.

Clean Power Plan
Based on EPA’s estimates, the net economic benefits of the rule could be around $7 billion in 2020, and then rise to $46 billion in 2030.  These figures included: compliance costs, an estimated reduction of 74 million metric tons of CO2 emissions in 2020 and a reduction of 375 million metric tons in 2030. The dollar values also counted health benefits resulting from the reduction of other pollutants like sulfur dioxide and nitrogen oxides. The economic benefits don’t include other potential positives of the rule like avoided premature deaths, lower exposure to hazardous air pollutants and impacts on ecosystems.

The researchers note that the economic benefits are calculated using a social cost of carbon, a complex metric that puts a dollar value on the emission of 1 ton of carbon. The value takes into account how rising global temperatures will affect the planet and society. In the president’s “energy independence” executive order, Trump signaled that the administration would seek to alter this method of calculating the costs of climate change, though agencies could use a related metric that would only take into account domestic impacts of climate change.

Motor Vehicle Emissions
Light-duty vehicles: The fuel efficiency improvements alone for light-duty vehicles are enough to offset the costs of implementing rules on emissions from these vehicles, according to the EPA figures the researchers cited. The net economic benefits of fuel efficiency standards for model years 2012 to 2016 are expected to be $34.7 billion in 2020 and $100.4 billion in 2030. Meanwhile, standards for model years 2017 through 2025 could lead to net benefits of $168 billion in 2020 and $81.4 billion in 2030. Medium and heavy-duty vehicles: According to EPA data, phase one of emissions standards for these vehicles, for model years 2014 to 2018, could lead to net benefits of $10 billion in 2020 and $27.3 billion in 2030. Phase two, for model years 2019 to 2028, could have net benefits of $31.5 billion in 2020 and $74.4 billion in 2030.

New Source Performance Standards for the Oil and Gas Sector
As with the Clean Power Plan, EPA used the social cost of carbon metric to calculate the net monetary benefits of controlling methane, volatile organic compounds and toxic air pollutants emitted from new and modified sources. The net benefits of the rule could be $37 million by 2020 and go up to $180 million in 2025. These numbers consider compliance costs and methane emissions reductions of 300,000 short tons in 2020 and 510,000 short tons in 2025. Not all benefits were included. EPA did not put a dollar value on the health benefits of potential reductions in ozone, which is formed from volatile organic compounds. Estimates also did not include potential natural gas savings from captured methane.
...

By Nadra Rahman and Jessica Wentz
August 3rd, 2017       

It’s a Superfund Site, but It’s Also Their Livelihood - The New York Times

...
Alberto Rodriguez', Los Primos Auto Repair and Sale, is one of six businesses at the intersection of Cooper and Irving Avenues in Ridgewood, Queens, that have been targeted for demolition as part of a cleanup plan released recently by the Environmental Protection Agency. The businesses are within a Superfund site, the term for sites covered by a program that finances the cleanup of hazardous waste.

The small, triangle-shaped tract, hemmed in on one side by an abandoned rail spur, does not look particularly active...  But for business owners like Mr. Rodriguez, who have turned the block into a one-stop shop for automotive needs ... the proposed plan threatens to uproot well-established livelihoods.
...
Mr. Rodriguez’s shop sits atop land formerly occupied by the Wolff-Alport Chemical Company, which from the 1920s through the 1950s extracted metals from imported sand. In the process, the company produced waste containing two radioactive elements, thorium and uranium, which it disposed of by dumping the waste into sewers and perhaps also by burying it .......
https://cumulis.epa.gov/supercpad/cursites/csitinfo.cfm?id=0206479
The E.P.A. has been aware of radioactive contamination at the site since at least 1988, but it was not until 2014 that the agency assigned Superfund status to the site. Before then, the E.P.A. installed interim protections, including placing slabs of concrete, lead and steel beneath floors and sidewalks to block radiation from emanating upward.

Those measures wreaked havoc with Mr. Rodriguez’s business, he said. 
...
The demolition plans are not final. Another possibility raised in the plan is the demolition of just the vacant warehouse and the excavation of soil around the remaining buildings. That option would require government checkups every five years, the plan said, with maintenance costs “in perpetuity.”
...
The health risks from the radiation at the site are small, said Dr. David Brenner, the director of the Center for Radiological Research at Columbia University Medical Center, who reviewed the E.P.A.’s risk estimates at a reporter’s request. If no further remediation were done at the site, a future resident would see an increased risk of cancer of about 0.005 percent, the plan predicted.

Walter Mugdan, an acting deputy regional administrator for the E.P.A., acknowledged that the site’s tenants “are not in any significant danger at all.” But the agency’s goal, he said, is to ensure that the site can be used in the future, perhaps even for residential development.
...
Any demolition would not be undertaken until 2019 or 2020 at the earliest, Mr. Mugdan said. About two dozen Superfund sites are ready for cleanup at any given time, he said, but because of limited funding, usually work begins on only six to eight each year. The projected cost of the government’s preferred plan for the Wolff-Alport cleanup is more than $39 million.

The E.P.A. often seeks to hold companies responsible for the contamination financially accountable for the cleanup, but Wolff-Alport has been defunct for decades. Mr. Mugdan said his agency would try to determine if the company ever sold itself to any existing firms.

The protracted timeline for demolition offers small consolation to the site’s current tenants. “The rent is crazy. I can’t find a place like that,” said Mr. Rodriguez, who pays $3,600 a month in rent.... The E.P.A. will offer small businesses up to $25,000 to help them set up at another location....
...
FOR FULL STORY GO TO:
By VIVIAN WANG
The New York Times https://www.nytimes.com
August. 4, 2017

Also see

The Role of Logistics in Practical Levelized Cost of Energy Reduction Implementation and Government Sponsored Cost Reduction Studies: Day and Night in Offshore Wind Operations and Maintenance Logistics

Abstract: This paper reveals that logistics make up at least 17% of annual operational expenditure costs for offshore wind farms. Annual operational expenditure is found to vary by a factor of 9.5, making its share of levelized cost of energy for offshore wind range from 13% to 57%. These are key findings of a 20-month research project targeting cost reduction initiatives for offshore wind systems. The findings reveal that cost-out measures are difficult to implement due to cultural differences. Implementation efforts are rendered by personnel located offshore in a harsh sea environment which is in stark contrast to the shore-based office personnel who develop studies directing cost reduction efforts. This paper details the company motivation to join industry-wide cost reduction initiatives. A business case for offshore wind operations and maintenance logistics yielding 1% savings in levelized cost of energy is included on how to expand working hours from daytime to also work at night.
Calculated annual OpEx cost ranges per mega-Watt for the eleven studies.
Energies 10 00464 g002
Scenarios displaying fluctuations in Operating Expenditure share of total costs.
Energies 10 00464 g003
Selected business case impact on offshore wind farm levelized cost of energy
Energies 10 00464 g004

Friday, August 4, 2017

SWEPCO Announces Major Project To Secure Low-Cost, Renewable Energy for Customers

Southwestern Electric Power Co. (SWEPCO) today announced plans for a major clean energy project that will provide 6 million megawatt-hours (mWh) of new wind energy annually to SWEPCO customers. SWEPCO will file applications July 31 with utility regulators in Arkansas, Louisiana and Texas to request approval for the project.

As proposed, SWEPCO will own 1,400 megawatts (MW) of a 2,000-MW wind farm under construction in Oklahoma. SWEPCO also will help build an approximately 350-mile, dedicated 765-kilovolt (kV) power line from the Oklahoma Panhandle to Tulsa to deliver the wind energy to customers.
...

The proposed Wind Catcher Energy Connection Project is expected to save SWEPCO customers more than $5 billion, net of cost, over the 25-year life of the wind farm, compared to projected market costs for procuring power over the same period.

Cost savings include no fuel cost for wind, which lowers SWEPCO’s overall fuel and purchased power costs; full value of the federal Production Tax Credit, which is available for construction of new wind farm projects; and the cost-efficient delivery of the wind generation to customers through the new, dedicated power line.
Customers will see savings primarily through a reduction in the fuel portion of their bills, beginning in 2021.

Public Service Company of Oklahoma (PSO), also a subsidiary of American Electric Power (NYSE: AEP), will own 600 MW of the same wind power plant and co-own the proposed power line, pending regulatory approval.

SWEPCO’s 70 percent share of the $4.5 billion Wind Catcher project is $3.2 billion.

If we keep subsidizing wind, will the cost of wind energy go down? [ The Conversation

As more wind turbines have been put in place, the cost of wind energy has gone down

There are high hopes for renewable energy to help society by providing a more stable climate, better energy security and less pollution. Government actions reflect these hopes through policies to promote renewable energy. In the U.S. since 1992 there’s been a federal subsidy to promote wind energy, and many states require electricity utilities to use some renewable energy.

But when is the right time to stop government support for an energy technology?

This is a timely question: Rick Perry’s Department of Energy is currently working on a grid reliability report that many expect to argue that wind and solar cause reliability problems because they don’t supply power continually. A conclusion like this can be used to justify removal of government subsidies or regulations favoring other sources of energy.

Subsidies need not last forever – there can come a time when its objective has been achieved or experience suggests the subsidy is not working as intended.

Is it time to end subsidies for wind? A big part of the answer to this question lies in whether subsidies are actually making wind cheaper.

Why subsidize energy technology

The justification for subsidizing a given technology is that it delivers public benefits that outweigh the subsidy cost. If a technology shows promise to become cheap enough, the subsidy can be viewed as a temporary stimulus to bring it a point where it can stand on its own.

For example, in the early days of the semiconductor industry, integrated circuits were too expensive for consumer markets. Government demand for military applications provided a critical bridge to bring down costs and activate broader markets.

On the other hand, subsidizing an emerging technology that has trouble bringing down costs may be inefficient. For decades, the U.S. government has subsidized or mandated production of corn ethanol. Yet ethanol is still not market-competitive, at least not with recent crude oil prices.

Wind power’s ‘learning curve’

The price for wind power has gone down over the years, but how cheap is it getting? There is a surprisingly diverse set of answers to this question. There are over 100 existing studies of wind cost trends, with results ranging from wind power becoming more expensive over time to becoming cheaper so quickly that it will soon be cheaper than fossil fuels. Curiously enough, while researchers have recently started to note disparities between studies, no one has yet grappled with explaining and reducing such variability. This is, unfortunately, a common situation in many research domains: Various groups get conflicting results from similar analyses, but no one works on understanding why these differences arise.

In a recent paper, we sought to better understand cost reductions in wind power by finding patterns in historical trends.

Wind costs follow what economists call a learning curve: For every doubling of wind production, the cost goes down by a fixed percentage. For example, if the price of electricity from wind is 10 cents per kilowatt-hour with a given number of wind farms, a 10 percent “learning rate” means that wind electricity would cost 10 percent less, or 9 cents per kilowatt-hour, if one doubles the number of wind farms.


Our main finding was that the learning rate for wind power is in the range of 7.7 percent to 11 percent. That means if more wind power is installed and the cost of energy continues to decline as it has in recent years, the cost of generating electricity with wind will fall from 5.5 cents/kilowatt-hour today to 4.1–4.5 cents/kilowatt-hour in 2030.

Previous studies obtained learning rates from -3 percent to +33 percent, the minus sign indicating wind becoming more, rather than less, expensive over time. Why are the results so different? We showed that one can get very different outcomes depending on the method and data range used.

First, we believe it is important to account for wind power costs in terms of the total cost to generate electricity. Many prior studies measured wind cost as the price to build the capacity to make electricity at peak wind times. But this is a poor measure because much of the progress in wind technology in recent years has been to generate more power when the wind is weaker.
https://www.flickr.com/photos/130749842@N07/16328618272/
Secondly, it is important to treat wind power as a global industry. The adoption of wind in one country helps the industry develop and grow so that wind becomes cheaper in other countries. Modeling wind adoption in only one nation can skew results.

Finally, results depend strongly on the date range of data used. Even with an identical method, the estimated learning rate can change up to 10 percent depending on which years of data you use.

To subsidize or not to subsidize?

So if wind costs will fall to 4.1–4.5 cents/kilowatt-hour in 2030, as we found, what does this mean for wind subsidies? The U.S. Energy Information Agency projects the cost of natural gas and coal power in 2030 will be 4.5 and 5 cents per kilowatt-hour respectively. Taking these numbers at face value, wind is on track to become cheaper than fossil fuels as a source of electricity.