Showing posts with label Nitrogen. Show all posts

Sunday, January 3, 2021

Nitrogen Washing Off Midwest Farms Cause Billions in Annual Damage to Gulf of Mexico Fisheries and Marine Habitat, New Study Finds - Dead Zone Compounds Crushing Pandemic Impact on Gulf Fishing Economy

With federal scientists expected to forecast, within days, the size of this year’s “dead zone” in the Gulf of Mexico, a new study shows that one of the dead zone’s biggest causes—nitrogen that flows downriver from Midwest farms—has been responsible for up to $2.4 billion in damages to Gulf fish stocks and their habitat every year for more than 30 years. The amount of nitrogen coming off Midwest corn and soybean farms, according to the Union of Concerned Scientists (UCS) study, equates to enough fertilizer to fill 3,000 standard size shipping containers every year since 1980 on average.

The economic analysis, detailed in the UCS report “Reviving the Dead Zone: Solutions to Benefit Both Gulf Coast Fishers and Midwest Farmers," built on peer-reviewed research that estimated the damage, in dollars, that a given quantity of excess nitrogen has on fisheries and marine habitat. UCS applied that damage value to the Gulf based upon the peak nitrogen influx between 1980 and 2017.

“Gulf Coast communities know that the dead zone impacts their livelihoods, but research has never put a dollar value on its damage to the fishing industry,” said Rebecca Boehm, an economist at UCS and author of the report. “This study quantifies both the amount of nitrogen flowing to the Gulf from farms upstream, and the toll it is taking economically on the foundation of the Gulf fishing industry.”

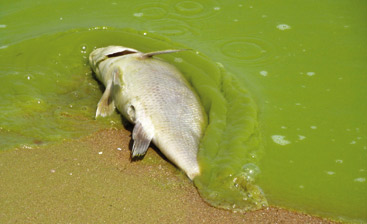
For many farmers looking to maximize yields and profits, inexpensive nitrogen fertilizer is a convenient boost to crops. However, increasingly intense rainfall in the spring flushes excess fertilizer into streams and rivers, and much of that nitrogen flows down the Mississippi River into the Gulf of Mexico. Nutrient overload in coastal waters creates low-oxygen areas, which can cause widespread die-offs of some fish and shellfish and drive others from their normal habitat. The persistently large dead zone can lead to reduced catch and increased fuel demands for Gulf fishers who must travel further out for their hauls.


Local residents’ professions, and by extension way of life, seem more threatened now than ever.
“Lots of factors cause shrimpers to lose business, but COVID-19 may completely shut many of us down,” said John Williams, executive director of the Southern Shrimp Alliance and a Gulf shrimper for more than three decades. “Hopefully the industry will get through this health crisis, and in the meantime, we need to address what we can to ensure the Gulf’s long-term sustainability. As long as the dead zone persists, our way of life, and the rich seafood culture of the region is in danger.”


Wednesday, January 8, 2020

Looking Back at Fifty Years of the Clean Air Act - After major expansion in 1970, the Clean Air Act led to substantial emissions reductions and health improvements—as well as some unintended consequences.

Abstract
Since 1970, transportation, power generation, and manufacturing have dramatically transformed as air pollutant emissions fell significantly. To evaluate the causal impacts of the Clean Air Act on these changes, we synthesize and review retrospective analyses of air quality regulations. The geographic heterogeneity in regulatory stringency common to many regulations has important implications for emissions, public health, compliance costs, and employment. Cap-and-trade programs have delivered greater emission reductions at lower cost than conventional regulatory mandates, but policy practice has fallen short of the cost-effective ideal. Implementing regulations in imperfectly competitive markets have also influenced the Clean Air Act’s benefits and costs.
  • Spatially varying regulations can impose substantial costs on local economies.
  • Current applications of market-based mechanisms may fall short of cost-saving expectations.
  • Varying fuel content regulations across the United States may impose unnecessary costs on consumers in separated markets.
  • Regulatory flexibility for fuel content rules doesn’t always yield cost-effective results.
  • Unanticipated costs arising from overly optimistic technology projections are an important issue in the design of renewable fuel requirements.
The SO2 program has been subject to extensive research, with a number of papers focusing on the early years (such as Carlson et al. 2000 and Ellerman et al. 2000) and some recent synthesis and review papers which combine ex-ante and ex-post papers (such as Schmalensee and Stavins 2013). The ex-ante analyses all suggest large cost savings based on a comparison of the least cost solution of achieving the cap to the command-and-control uniform performance standard case. Carlson et al. (2000) note that this cost reduction reflected dramatic declines in their estimated marginal abatement cost functions for sulfur dioxide emissions resulting from changes in technology and low-sulfur coal prices over 1985-1995.

The only true ex post study of the program’s benefits and costs is by Chan et al. (2018), which finds much smaller cost savings than predicted ex ante. In part, this is the result of decisions of several power plants—in concert with their state public utility commissions—to install scrubbers rather than comply by purchasing allowances and/or using low sulfur coal, a decision that Chan et al. estimate increased annual compliance costs by nearly $100 million. Focusing on 2002 as a Phase II year before the transition to a period of regulatory uncertainty and using a mixed logit model of the firm’s compliance decision, the authors find that the SO2 program reduced compliance costs by about $200 million (1995$) and increased public health benefits by roughly $170 million. Chan et al. examine a performance standard that delivers the same aggregate emission outcome as the Acid Rain Program in 2002, which had much higher emissions than the cap due to use of banked allowances. Thus, the cost-savings of the two instruments may be smaller than they would have been under the statutory cap for 2002. Chan et al. also find that the prevailing pattern of allowance trading— from western generating units in sparsely populated areas to eastern generating units in more densely populated areas—increases public health damages by about $2 billion relative to a no-trade counterfactual.
...
The Chan et al. paper builds on the insights in Muller and Mendelsohn (2009), which illustrated through an integrated assessment model how the location of an emission source relative to a downwind population could dramatically affect the monetized damages of a ton of sulfur dioxide emitted at that source. In their counterfactual analyses, Muller and Mendelsohn estimated that trading ratios, based on the relative damages associated with a ton of emissions for a pair of locations, could improve social welfare by nearly $1 billion per year compared to the ton-for-ton trading in the SO2 program as implemented. However, such differentiation in cap-and-trade implementation raises questions about administrative feasibility and accuracy in estimating ratios, especially in the presence of a complicated atmospheric chemistry that could induce negative ratios for NOx (Fraas and Lutter 2012). 
...
While overall coal prices fell during the latter half of the 1990’s, Busse and Keohane found that delivered prices rose for plants covered by Phase I of the SO2 cap-and-trade program relative to those still operating under command-and-control regulation, and prices rose more at plants near a low-sulfur coal source. Overall, they estimate that railroads enjoyed an increase in annual producer surplus of more than $40 million, which represented about 15 percent of the economic surplus created by the cap-andtrade program....

Tuesday, March 7, 2017

Costs of Nitrogen Runoff for Rural Water Utilities: A Shadow Cost Approach

Abstract:
This paper explores the interactions among scale and density economies, productive efficiency, water quality, and customer characteristics, and their impact on the costs of delivering treated drinking water. Implicit benefits of nitrogen abatement are also derived and hypothesis tests concerning their hypothesized drivers are conducted. Key findings are that nitrogen removal costs increase with rising raw water nitrogen concentration coming from agricultural activities, and that network density and system size matter in determining average total costs of community water systems. Merging water systems to take advantage of scale economies may be difficult due to the heterogeneity of the sector, however.
...
Location 1 has an estimated average total cost of $1,800 per million gallons of water per year, while locations 2, 3, 4, and 5 have an average estimated cost of $1,876, $1,798, $1,807, and $1,758 in 1995 dollars, respectively, or 2%, 6%, 2%, and 3% difference in costs between regions 1, 2, 3, and 4, respectively, relative to region 5. Comparisons of costs between location 2 and other regions are statistically significant in every case.
...
© Michigan Sea Grant
Increasing returns to economies of scale in water production are exhausted in the interval of 10,254 to 22,630 million gallons for the water sector overall. Thereafter, decreasing returns to scale set it. 
...
Small water utilities have a marginal cost of nitrogen removal that is about 0.14 of that of large CWSs, that is, those that have 100,000 or more customers in their service area. Smaller water utilities remove 8.4 times more nitrogen than water utilities with a large customer base. The elasticity of variable costs with respect to nitrogen removal implies that variable costs increase by 0.03% for small utilities and 0.004% for large water utilities from increasing removed nitrogen by 1%. This difference points to increasing returns to scale in nitrogen abatement....

Wednesday, January 18, 2017

Defensive Investments and the Demand for Air Quality: Evidence from the NOx Budget Program

Abstract:      
The demand for air quality depends on health impacts and defensive investments that improve health, but little research assesses the empirical importance of defenses. We study the NOx Budget Program (NBP), an important cap-and-trade market for nitrogen oxides (NOx) emissions, a key ingredient in ozone air pollution. A rich quasi-experiment suggests that the NBP decreased NOx emissions, ambient ozone concentrations, pharmaceutical expenditures, and mortality rates. Reductions in pharmaceutical purchases and mortality are valued at about $800 million and $1.5 billion annually, respectively, in a region covering 19 Eastern and Midwestern United States; these findings suggest that defensive investments account for more than one-third of the willingness-to-pay for reductions in NOx emissions. Further, the NBP’s estimated benefits easily exceed its costs and instrumental variable estimates indicate that the estimated benefits of NOx reductions are substantial.
nitrogen oxide cycle
by Olivier Deschenes 1, Michael Greenstone 2 and Joseph S. Shapiro 
1. University of California, Santa Barbara - College of Letters & Science - Department of Economics;
1. National Bureau of Economic Research (NBER); IZA Institute of Labor Economics
2. University of Chicago - Department of Economics; National Bureau of Economic Research (NBER)
3. Yale University, Department of Economics; National Bureau of Economic Research (NBER); Yale University - Cowles Foundation
Social Science Research Network (SSRN) www,SSRN.com
June 1, 2016, Number of Pages in PDF File: 74
Keywords: willingness to pay for air quality, cap and trade, ozone, pharmaceuticals, mortality, compensatory behavior, human health

Friday, January 13, 2017

Physical and monetary ecosystem service accounts for Europe: A case study for in-stream nitrogen retention

Highlights
• We present a case study of ecosystem accounting based on the SEEA-EEA framework.
• Accounts for water purification are developed in physical and monetary terms.
• Flow accounts include both actual and sustainable flows.
• Capacity is assessed as Net Present Value of the sustainable flow.
• Replacement cost is the exchange value technique used for the monetary valuation.

Abstract
In this paper we present a case study of integrated ecosystem and economic accounting based on the System of Environmental Economic Accounting — Experimental Ecosystem Accounts (SEEA-EEA). We develop accounts, in physical and monetary terms, for the water purification ecosystem service in Europe over a 20-year time period (1985–2005). The estimation of nitrogen retention is based on the GREEN biophysical model, within which we impose a sustainability threshold to obtain the physical indicators of capacity – the ability of an ecosystem to sustainably supply ecosystem services. Key messages of our paper pertain the notion of capacity, operationalized in accounting terms with reference to individual ecosystem services rather than to the ecosystem as a whole, and intended as the stock that provides the sustainable flow of the service. The study clarifies the difference between sustainable flow and actual flow of the service, which should be calculated jointly so as to enable an assessment of the sustainability of current use of ecosystem services. Finally, by distinguishing the notion of ‘process’ (referred to the ecosystem) from that of ‘capacity’ (pertaining specific services) and proposing a methodology to calculate capacity and flow, we suggest an implementable way to operationalize the SEEA-EEA accounts.

...
We calculate that replacing this ecosystem service capacity would require approximately one million ha of constructed wetland, representing a net present value of between 310 billion € in 1990 and 459 billion € for the year 2005.
...
Monetary flows by country follow:
A river flowing into a lake surrounded by green rushes
by Alessandra La Notte 1, Joachim Maes 1, Silvana Dalmazzone 2, Neville D. Crossman 3, Bruna Grizzetti 1, Giovanni Bidoglio 1
1. European Commission - Joint Research Centre, Directorate D – Sustainable Resources, Via Enrico Fermi 2749, 21027 Ispra, VA, Italy
2. Department of Economics and Statistics, University of Torino, Campus Luigi Einaudi, Lungo dora Siena 100, 10153 Torino, Italy
3. CSIRO Land and Water Flagship, Waite Campus, 5064 Adelaide, South Australia, Australia
Ecosystem Services via Elsevier Science Direct www.ScienceDirect.com
Volume 23, February 2017, Pages 18–29
Keywords: Ecosystem accounting; Ecosystem services; Water purification; Capacity; Sustainable flow; Actual flow

Tuesday, January 10, 2017

Examining the ecosystem service of nutrient removal in a coastal watershed

Highlights
...
• The Piscataqua-Salmon Falls watershed community needs to address wastewater treatment plants.
• Conservation could reduce 3–28 t/yr of Nitrogen, worth 10–50 million dollars over ten years.
• Even under high conservation removal estimates of 28.1 ton/yr, point source reductions are needed.

Abstract
Globally, managers are trying to prevent or halt the eutrophication of valuable estuaries and bays by reducing nutrient inputs, but justifying the cost of conservation or processing facility upgrades often proves challenging. We focus on a coastal watershed in Maine and New Hampshire struggling with the financial burdens of nitrogen pollution mandates due to the eutrophication of the Great Bay estuary. After creating two future watershed land cover scenarios comparing plausible extremes, we ran them through two models, the Natural Capital Project’s InVEST (Integrated Valuation of Ecosystem Services and Tradeoffs) and a detailed hydrologic and biogeochemical river network model FrAMES (Framework for Aquatic Modeling of the Earth System). Through this work, we both evaluated and valued the ecosystem service of nitrogen retention. We find that both models provide numerical arguments for conservation efforts, and decision makers would benefit from using either an ecosystem services model or a biogeochemical model when dealing with complex issues like nutrient overenrichment. According to both our modeling results, modest watershed conservation efforts as defined by our expert stakeholders, ie: protecting wetlands and forests, could reduce the amount of total nitrogen entering the Great Bay estuary in the range of 3–28 metric tons per year.
aerial shot of Little Bay and Great Bay
by Chelsea E. Berg 1, Madeleine M. Mineau 2 and Shannon H. Rogers 1 
1. Center for the Environment, Plymouth State University, United States MSC 63 17 High Street, Plymouth, NH 03264, United States.
2. Earth Systems Research Center, University of New Hampshire, Durham, NH, USA
Ecosystem Services http://www.sciencedirect.com/science/journal/22120416 via Elsevier Science Direct www.ScienceDirect.com
Volume 22, Part B, December 2016, Available online 24 December 2016; Pages 309–317
Special Issue: Integrated valuation of ecosystem services: challenges and solutions
Keywords: Ecosystem service valuation; Nutrient retention; InVEST; Great Bay; Avoided cost analysis; FrAMES

Monday, February 15, 2016

Social Costs of Morbidity Impacts of Air Pollution

Abstract:
Outdoor air pollution is a major determinant of health worldwide. The greatest public health effects are from increased mortality in adults. However, both PM and O3 also cause a wide range of other, less serious, health outcomes; and there are effects on mortality and morbidity of other pollutants also, e.g. nitrogen dioxide (NO2) and sulphur dioxide (SO2). These adverse health effects have economic consequences; OECD (2014) suggests that the social costs of the health impact of outdoor air pollution in OECD countries, China and India was approximately USD 1.7 trillion and USD 1.9 trillion, respectively, in 2010. However, the study highlights that though the social costs of premature mortality account for the majority of these totals, the social costs of morbidity remain poorly estimated. The objective of this paper is to inform the development of improved estimates of the social costs of human morbidity impacts resulting from outdoor air pollution in two components; namely to develop a core set of pollutant-health end-points to be covered when estimating the costs of morbidity, and to review current estimates of the cost of morbidity from air pollution.
Nitrogen dioxide 2014 - global air quality levels
https://en.wikipedia.org/wiki/Air_pollution

Picture: UNECE 
UNECE http://tinyurl.com/gs4wceb
The full report is available free of charge
by Alistair Hunt 1, Julia Ferguson 2, Fintan Hurley 3, Alison Sear l and 3
1. University of Bath, United Kingdom
2. University of Cranfield, United Kingdom
3. Institute of Occupational Medicine, United Kingdom
OECD www.oecd.org Environment Working Papers
Number 99; January 28, 2016; 78 pages
Keywords: health impact assessment, air quality regulation, non-market valuation

Tuesday, January 21, 2014

Cars on Crutches: How Much Abatement Do Smog Check Repairs Actually Provide?

Not as much abatement as has been presumed. Smog check programs aim to curb tailpipe emissions from in-use vehicles by requiring repairs whenever emissions, measured at regular time intervals, exceed a certain threshold. Using data from California, we estimate that on average 41 percent of the initial emissions abatement from repairs is lost by the time of the subsequent inspection, normally two years later. Our estimates imply that the cost per pound of pollution avoided is an order of magnitude greater for smog check repairs than alternative policies such as new-vehicle standards or emissions trading among industrial point sources.
...
CA Smog & Emission Checks
A September, 2012  version  of the paper available at http://www.uce3.berkeley.edu/abstract_044.html noted: 
In our most conservative scenario, we estimate that each pound of CO, NOx, and HC avoided requires $2.17 in repairs for the average vehicle and $1.27 for gross polluters. Of these three pollutants, CO is by far the least toxic (Small and Kazimi, 1995). If we only credit the NOx and HC abatement, our estimated cost rises by a factor of ten to $17.91 on average and $12.49 for gross polluters. These estimates understate the total cost of the program because they use only the direct cost of emissions-related repairs and exclude factors such as administrative costs and the opportunity cost of driving to and from the station for both failing and compliant vehicles.

Friday, August 24, 2012

Electric Power Research Institute (EPRI) Announces Plan to Initiate Water Quality Pilot Trades

http://tinyurl.com/ckl2eoc
Faced with a planned federal mandate to cut water pollution from power plants, American Electric Power and other utility companies might simply pay farmers to do the job for them.

In a “water quality trading” test program ... farmers could cut polluted stormwater runoff from their fields and sell the reductions as credits to power companies.

Streams, rivers and lakes should be cleaner.  Installing and operating pollution-treatment systems at power plants would likely be much more expensive
...
Farming frequently is cited in government reports as the No. 1 source of the phosphorus and nitrogen pollution that plagues streams and lakes. The compounds, which are found in manure and fertilizers, run off fields during storms.  Power plants release nitrogen from ammonia, which is used in scrubbers and filters to cut air pollution. Nitrogen and phosphorus help grow thick mats of toxic, blue-green algae in lakes. Nitrogen also flows down the Ohio and Mississippi rivers to help form a vast, oxygen-depleted dead zone in the Gulf of Mexico.  Ohio and other states are working under a federal mandate to come up with phosphorus and nitrogen limits for streams. When those limits would be set is not clear.
...
AEP’s Cardinal station, located along the Ohio River ... would be among the first plants to participate in the program.... A company spokeswoman said it would cost $52 million to install a system to keep Cardinal’s ammonia out of the Ohio River and at least $3 million a year to operate it.  Paying farmers to cut a similar amount of phosphorus, she said, could cost as little as $100,000 a year.  Farmers typically plant buffer strips of grass along ditches and streams instead of using those areas to grow crops. The strips absorb manure and fertilizers washed from fields during storms.  Whether farmers participate depends on whether they can make more money from selling credits than they could growing corn or soybeans.
...
While some states have adopted trading policies or rules to govern trading within their jurisdictions, this is the first interstate trading program where several states will operate under the same rules and a water quality credit generated in one state can be applied in another. 
....
EPRI launched its Ohio River Basin water quality trading project in 2009 as a first-of-its-kind interstate multi-credit trading program. It represents a comprehensive, scientifically-based approach to designing and developing markets for nitrogen, phosphorus and potentially greenhouse gas reduction credits.

The project supports the adoption of agricultural conservation practices to reduce nutrient loads in Ohio River Basin waters and improve local and regional water quality.

Pilot trades are expected to include at least three power plants or other participants and up to 30 farms implementing agricultural conservation best management practices on up to 20,000 acres. Nutrient reductions are expected to total approximately 45,000 pounds of nitrogen and 15,000 pounds of phosphorus annually.

The pilot project is already the world's largest water quality trading program operating under a common trading plan. At full-scale, the project could include up to eight states in the Ohio River Basin and would potentially create credit markets for 46 power plants, thousands of wastewater facilities and other industries, and approximately 230,000 farmers.
...
The Electric Power Research Institute, Inc. (EPRI) www.epri.com
Press Release dated August 9, 2012

Tuesday, August 21, 2012

The Health Effects of Coal Electricity Generation in India

Abstract: To help inform pollution control policies in the Indian electricity sector we estimate the health damages associated with particulate matter, sulfur dioxide (SO2), and nitrogen oxides (NOx) from individual coal-fired power plants. We calculate the damages per ton of pollutant for each of 89 plants and compute total damages in 2008, by pollutant, for 63 plants. We estimate health damages by combining data on power plant emissions of particulate matter, SO2 and NOx with reduced-form intake fraction models that link emissions to changes in population-weighted ambient concentrations of fine particles. Concentration-response functions for fine particles from Pope et al. (2002) are used to estimate premature cardiopulmonary deaths associated with air emissions for persons 30 and older. Our results suggest that 75 percent of premature deaths are associated with fine particles that result from SO2 emissions. After characterizing the distribution of premature mortality across plants we calculate the health benefits and cost-per-life saved of the flue-gas desulfurization unit installed at the Dahanu power plant in Maharashtra and the health benefits of coal washing at the Rihand power plant in Uttar Pradesh.
...
Coal washing reduces the ash content of coal and improves its heating value: it also removes small amounts of other substances, such as sulfur and hazardous air pollutants. The use of washed coal improves the combustion efficiency of a plant (less coal needs to be burned to produce electricity). Per unit of heat input, particulate and sulfur emissions are reduced, as are flyash disposal costs and the cost of transporting coal. Use of washed coal may also reduce plant maintenance costs and increase plant availability....

We examine the costs and benefits of using washed coal at the Rihand plant,... a 2,000 MW plant that in 2008 produced 17,000 GWh of electricity, using coal with a sulfur content of 0.39 percent and an ash content of 43 percent. We assume that using washed coal would reduce the ash content of coal burned to 35 percent and the sulfur content to 0.34 percent and would raise the heating value of coal by 17 percent. Based on information provided by the CEA, we calculate the levelized cost of electricity generation (lcoe) at Rihand using unwashed coal to be 1.206 Rs/kWh. We estimate that using washed coal increases the lcoe by 16.5 percent, to 1.405 Rs/kWh.... Our cost analysis focuses only on the yield and direct operating costs of washing. Other researchers have found that the use of washed coal leads to significant gains in generation plant availability and plant load factor and reductions in repair costs (see, for example, Zamuda and Sharpe 2007). Our estimates take no account of these economic benefits, nor of likely rail freight savings.

The health benefits of coal washing ... come from reductions in the ash content of coal, which reduces PM2.5 emissions, and reductions in sulfur emissions. Tons of PM2.5 and SO2 emitted are also reduced by the fact that less coal need be burned to generate electricity. Although coal washing is usually regarded as a measure aimed at reducing SPM emissions, our analysis indicates that benefits due to the reduction in SO2 far outweigh those of lower PM2.5 emissions.....

The net impact of coal washing on mortality associated with air emissions from the Rihand plant is to save 251 lives. The increased cost of coal washing is Rs 3.39 billion, implying a cost per life saved of approximately Rs 13.5 million. This figure falls within the range of estimates of the value of a statistical life (VSL) for India which, conservatively estimated, ranges from Rs 1 million to Rs 15 million.  Bhattacharya et al. (2007) report a preferred VSL estimate of Rs 1.3 million (2006 Rs) based on a stated preference study of Delhi residents. Madheswaran’s (2007) estimate of the VSL based on a compensating wage study of workers in Calcutta and Mumbai is approximately Rs 15 million. Shanmugam (2001) reports a much higher value (Rs 56 million) using data from 1990.

Wednesday, June 6, 2012

Estimating the shadow prices* of SO2 and NOx for U.S. coal power plants: A convex nonparametric least squares approach

Abstract: Weak disposability between outputs and pollutants, defined as a simultaneous proportional reduction of both outputs and pollutants, assumes that pollutants are byproducts of the output generation process and that a firm can “freely dispose” of both by scaling down production levels, leaving some inputs idle. Based on the production axioms of monotonicity, convexity and weak disposability, we formulate a convex nonparametric least squares (CNLS) quadratic optimization problem to estimate a frontier production function assuming either a deterministic disturbance term consisting only of inefficiency, or a composite disturbance term composed of both inefficiency and noise. The suggested methodology extends the stochastic semi-nonparametric envelopment of data (StoNED) described in Kuosmanen and Kortelainen (2011). Applying the method to estimate the shadow prices of SO2 and NOx generated by U.S. coal power plants, we conclude that the weak disposability StoNED method provides more consistent estimates of market prices.

Highlights

► Develops methodology to estimate shadow prices for SO2 and NOx in the U.S. coal power plants.
► Extends CNLS and StoNED methods to include the weak disposability assumption.
► Estimates the range of SO2 and NOx shadow prices as 201–343 $/ton and 409–1352 $/ton.
► StoNED method provides more accurate estimates of shadow prices than deterministic frontier.


by Maethee Mekaroonreung E-mail the corresponding author and Andrew L. JohnsonE-mail the corresponding author both of Department of Industrial and Systems Engineering, Texas A&M University, College Station, TX 77843-3131, USA
Energy EconomicsVolume 34, Issue 3; May, 2012; Pages 723–732
A full free version of the paper is currently available at http://ise.tamu.edu/ajohnson/CNLS_ShadowPrice.pdf
Keywords: Frontier estimation; Nonparametric regression; Parametric programming; Shadow pricing
* A shadow price can be defined as:
  • The calculated price of a good or service for which no market price exists 
  • Opportunity cost of an activity or project to a society, computed where the actual price is not known or, if known, does not reflect the real sacrifice made.