Tuesday, January 5, 2016

Climate Change and Long-Run Discount Rates: Evidence from Real Estate

The optimal investment to mitigate climate change crucially depends on the discount rate used to evaluate the investment’s uncertain future benefits. The appropriate discount rate is a function of the horizon over which these benefits accrue and the riskiness of the investment. In this paper, we estimate the term structure of discount rates for an important risky asset class, real estate, up to the very long horizons relevant for investments in climate change abatement. We show that this term structure is steeply downward-sloping, reaching 2.6% at horizons beyond 100 years. We explore the implications of these new data within both a general asset pricing framework that decomposes risks and returns by horizon and a structural model calibrated to match a variety of asset classes. Our analysis demonstrates that applying average rates of return that are observed for traded assets to investments in climate change abatement is misleading. We also show that the discount rates for investments in climate change abatement that reduce aggregate risk, as in disaster-risk models, are bounded above by our estimated term structure for risky housing, and should be below 2.6% for long-run benefits. This upper bound rules out many discount rates suggested in the literature and used by policymakers. Our framework also distinguishes between the various mechanisms the environmental literature has proposed for generating downward-sloping discount rates. 
...
The expected return on real estate is 5.9%, just below our empirical net return estimates between 6.4% and 8.0%. Expected rent growth is 1.6%. Our calibration implies that returns as well as rent growth are about as volatile as equity, with 8.2% and 14.2%, respectively. In line with our empirical findings, rental yields contribute more than two thirds to total returns. The term structure of discount rates for real estate is downward sloping as shown in Panel B of Figure VII. It falls from 17.8% for claims to one year ahead rents, to 3.9% for claims to rents one hundred years ahead, all the way to 2.3% for one thousand year ahead rents
...
[The] upper bound is lower than numerous estimates used in the existing literature and by policymakers for discounting investments in climate change abatement. For example, it is substantially below the 4% suggested by Nordhaus (2013) and the 4.6% suggested by Gollier (2013). Quantitatively, it is more in line with long-run discount rates that are close to the risk-free rate, as suggested by Weitzman (2012), or the 1.4% suggested by Stern (2006)31, or results by Barro (2013). It is also close to the average recommended long-term social discount rate of 2.25% elicited by Drupp et al. (2015) in a survey of 197 experts, and falls within the range of 1% to 3% that more than 90% of these experts are comfortable with. At the same time, while some authors have proposed low long-run discount rates for climate change abatement, the theoretical arguments underlying these proposals vary widely, and some are at odds with our empirical evidence....

In light of the general disagreement in the literature regarding the appropriate discount rate, the interagency group tasked by the U.S. government to value reductions in CO2 chose three certainty-equivalent constant discount rates: 2.5%, 3%, and 5% per year. Our estimates provide a tight bound that is only consistent with the lowest rate of 2.5% for investments providing a long-run hedge against climate disasters. Greenstone, Kopits and Wolverton (2013) report the cost of 1 metric-ton of CO2 to be $57 when using our suggested 2.5% discount rate, but only $11 when using a 5% discount rate, illustrating the impact of this bound on climate-change-related welfare calculations (see also Pizer et al., 2014)


UN-Habitat
Technical Guidelines For Resilience House Construction To Climate Change 
by Stefano Giglio, Matteo Maggiori, Johannes Stroebel and Andreas Weber
National Bureau of Economic Research (NBER) www.NBER.org
NBER Working Paper No. 21767; Issued in November 2015

Measuring impacts of extreme weather events using the life satisfaction approach

Abstract
Extreme weather events cause harm among the aggrieved party that often goes beyond material damages. This paper studies the impact of extreme weather events on measures of self-reported life satisfaction. Focusing on Germany, we use representative panel data for 2000–2011 to study the effect of seven storm & hail events and five floods on subjective well-being in the affected NUTS 3 regions. Our results indicate that both weather experiences bear statistically significant negative externalities. Following an extreme weather event, life satisfaction is reduced by 0.020–0.027 on the 11-point scale. While the effect of storm & hail events is rather immediate in nature, the effect from floods persists much longer.

Highlights
• We estimate well-being effects of extreme weather events (floods and storm & hail events).
• We find a small but significant decline in life satisfaction due to an extreme weather event.
• While storms tend to have a short term effect on subjective well-being, the effect of floods persists much longer.
• The results indicate that insurances can at least partly offset well-being losses from floods.

http://www.sciencedirect.com/science/article/pii/S0921800915004450
by Charlotte von Möllendorff 1 and Jesko Hirschfeld 2 
1. Carl von Ossietzky University Oldenburg, Department of Economics, 26111 Oldenburg, Germany
2. Institute for Ecological Economy Research (IÖW), Potsdamer Str. 105, 10785, Berlin, Germany
Ecological Economics via Elsevier Science Direct www.ScienceDirect.com
Volume 121; January, 2016, Pages 108–116, Available online 4 December 2015
Keywords: Extreme weather events; Subjective well-being; Life satisfaction; Nonmarket valuation
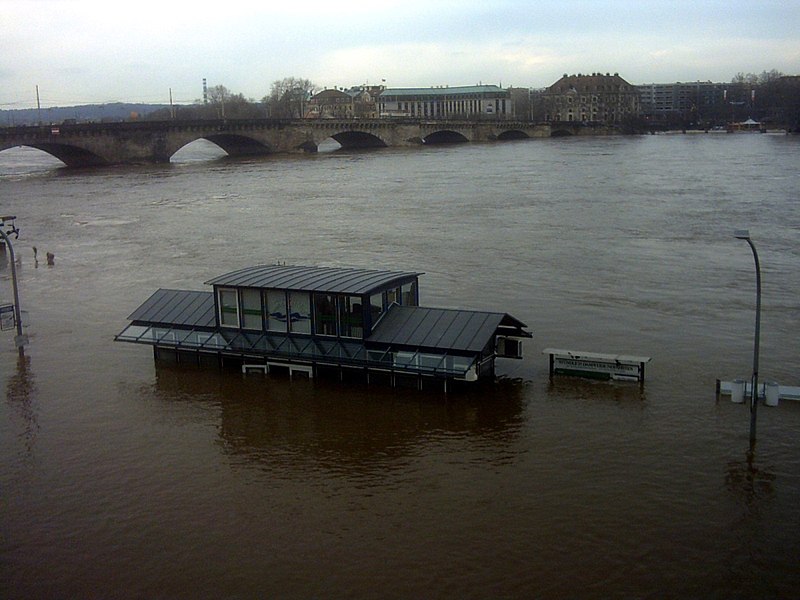
File:Flood dresden april2006 004.jpg
Elbe Flood 2006 http://tinyurl.com/zcj6eo8

Monday, January 4, 2016

Consumers' willingness to pay for green electricity: A meta-analysis of the literature

Abstract:
At present, electricity generated from power plants using renewable sources costs more than electricity generated from power plants using conventional fuels. Consumers bear these expenses directly or indirectly through higher prices for renewable energy or taxes. The number of studies published over the last few years focusing on people's preferences for renewables has increased steadily, making it more and more difficult to identify key explanatory factors that determine people's willingness-to-pay (WTP) for renewables. We present results of a meta-regression on valuation of consumer preferences for a larger share of renewable energy in their electricity mix. Our meta-regression results reveal a number of important factors that explain the differences in WTP values for renewable energy. Different valuation methods show widely different values, with choice experiments producing the highest estimates. Our results further indicate that consumers' WTP for green electricity differs by source, with hydropower being the least valued. Variables that are often omitted from primary valuation studies are important in explaining differences in values. These variables describe individual and household characteristics as well as information on the type of power plant that will be replaced by renewables. Further, the marginal effect of a survey conducted in the US is pronounced. We also assess the potential for using the results for out-of-sample value transfer and find a median error of 21%.
... 

An extensive search for publish and unpublished ... studies relating to WTP for renewable energy was conducted on Web of Science, EconBiz, and Google Scholar and following references of relevant studies.... Overall, we count 23 studies for Europe, twelve for the Americas and six for Asia. At the country level, most of the surveys were conducted in the US (twelve publications ...).  Among the 43 studies, we exclude 25 from the meta-regression because of sample selection bias (e.g., Gossling et al., 2005) or unsuitable units of WTP estimates; that is, inconvertible.... Our final meta-regression consists of 85 WTP values that are ascertained from 18 studies.... To ensure comparability, we convert WTP values in US$ per household per month and adjust them to 2010 prices using purchasing power parity exchange rates. 

In our sample, the mean WTP for a higher renewable energy share in the electricity mix is US$13.13 per household per month and the median WTP is US$11.67. The lowest WTP (US$1.00) is found by Borchers et al. (2007) for an increase in biomass in the US. Hanemann et al. (2011) report the highest WTP (US$43.01) for an increase in renewables in Spain. Overall, the distribution of WTP values is positive skewed. When WTP is measured in kilowatt-hours, the mean WTP is US-Cents 3.18/kilowatt-hour and the median WTP is US-Cents 1.95/kilowatt-hour.

At the country level (see Fig. 2), the highest mean WTP per household (US$21.39), which corresponds to a mean WTP per kilowatthour of US-Cents 3.07, is observed for Finland. However, we observe the opposite for Chile, the country with the second lowest residential energy consumption per capita. Here, the WTP per household (US$10.98) is below average while the WTP per kilowatt-hour (US-Cents 6.82) is ranked highest. Furthermore, China and South Korea have the lowest WTP per household and per kilowatt-hour. Although Japan demonstrates an above average WTP per household, the average WTP for Asia (see Fig. 3) is half that of European countries and countries in the Americas, which are quite similar. With respect to the average WTP per kilowatt-hour, the WTP for Asia is the lowest.  However, in contrast to the WTP per household, there exists a significant difference between the mean WTP for the Americas (US-Cents 2.49) and for Europe (US-Cents 4.43)
 
Energy Economics via Elsevier Science Direct www.ScienceDirect.Com
Volume 51; September, 2015; Pages 1–8
by Swantje Sundt 1 and Katrin Rehdanza 2

1. Kiel Institute for the World Economy, Kiellinie 66, 24105 Kiel, Germany
2. University of Kiel, Department of Economics, 24098 Kiel, Germany
Tel.: + 49 431 8814 408
Keywords: Meta-analysis; Renewable energy; Valuation; Value transfer; Willingness to pay
Highlights
• A large WTP per household is not necessarily accompanied by a large WTP per kWh.
• WTP for green electricity differs by source, hydropower being the least valued.
• WTP for renewables increases if they substitute conventional energy sources.
• WTPs differ when a respondent's personal characteristics are accounted for.
• The out-of-sample value transfer leads to a median error of around 21%.

Sunday, January 3, 2016

Science and the stock market: Investors' recognition of unburnable carbon

Abstract
This paper documents the stock market's reaction to a 2009 paper in the Nature journal of science, which concluded that only a fraction of the world's existing oil, gas, and coal reserves could be emitted if global warming by 2050 were not to exceed 2 °C above pre-industrial levels. This Nature article is now one of the most cited environmental science studies in recent years. Our analysis indicates that this publication prompted an average stock price drop of 1.5% to 2% for our sample of the 63 largest U.S. oil and gas firms. Later, in 2012–2013, the press “discovered” this article, writing hundreds of stories on the grim consequences of unburnable carbon for fossil fuel companies. We show only a small negative reaction to these later stories, mostly in the two weeks following their publication. This limited market response contrasts with the predictions of some analysts and commentators of a substantial decline in the shareholder value of fossil fuel companies from a carbon bubble. Our paper discusses possible reasons for this discrepancy.
Unburnable Carbon
https://www.ucc.ie/en/eri/news/fullstory-543289-en.html

http://www.sciencedirect.com/science/article/pii/S0140988315002546
by Paul A. Griffin 1, Amy Myers Jaffe 2, David H. Lont 3 and Rosa Dominguez-Faus 2
1. Graduate School of Management, University of California, Davis, USA; Tel.: + 64 3 479 8119.
2. Graduate School of Management and Institute of Transportation Studies, University of California, Davis, USA
3. Department of Accountancy & Finance, University of Otago, Dunedin, New Zealand
Energy Economics via Elsevier Science Direct www.ScienceDirect.com
Volume 52, Part A; December, 2015; Pages 1–12; Available online 25 September 2015
Keywords: U.S. energy companies; Unburnable carbon; Stranded assets; Nature journal; Media attention; Event studyby Paul A. Griffin 1, , Amy Myers Jaffe 2, , David H. Lont 3 and Rosa Dominguez-Faus 2,
1. Graduate School of Management, University of California, Davis, USA
2. Graduate School of Management and Institute of Transportation Studies, University of California, Davis, USA
3. Department of Accountancy & Finance, University of Otago, Dunedin, New Zealand
Energy Economics via Elsevier Science Direct www.ScienceDirect.com
Volume 52, Part A; December, 2015; Pages 1–12; Available online 25 September 2015
http://priceofoil.org/2013/01/29/bankers-warn-oil-is-unburnable-carbon/


Dredging versus hedging: Comparing hard infrastructure to ecosystem-based adaptation to flooding


Abstract:
Efforts to ameliorate flooding have historically centred on engineered solutions such as dredging rivers, building levees, and constructing spillways. The potential for ecosystem-based adaptation (EbA) options is becoming increasingly apparent; however, implementation is often limited by a poor understanding of their costs and benefits.

This study compares the costs and benefits of a range of hard infrastructure and ecosystem-based adaptation options to mitigate flooding under climate change using data from two catchments in Fiji. We employ unique survey data to document the costs of flooding under various climate change scenarios. We then use a hydrological model to simulate the potential benefits of a range of hard infrastructure and EbA options and conduct a comprehensive cost–benefit analysis.

We find that under reasonable economic assumptions, planting riparian buffers is the most cost-effective option, yielding benefit–cost ratios between 2.8 and 21.6. However, the absolute level of protection provided by this strategy is low. Afforestation provides greater overall benefits, yielding net present values between 12.7 and 101.8 million Fijian dollars, although implementation costs would be substantial. Planting floodplains and reinforcing riverbanks provide some monetary benefits that are lower than riparian and upland planting. Elevating houses is not economically viable under any climate scenario.


UN February 2012  http://tinyurl.com/h3zckwv


Afforesting upper catchments provide greatest overall net benefits.... Benefits increase by 100% or more when accounting for climate change.
by A. Daigneault 1, P. Brown 2, D. Gawith 3
1. Landcare Research, 231 Morrin Road, St Johns, Auckland 1072, New Zealand
2. Landcare Research, Gerald Street, Lincoln 7608, New Zealand
3. Department of Land Economy, University of Cambridge, 16-21 Silver Street, Cambridge CB3 9EP, United Kingdom
Ecological Economics via Elsevier Science Direct www.ScienceDirect.com
Volume 122, February 2016, Pages 25–35; Available online 17 December 2015
Keywords: Disaster risk reduction; Cost–benefit analysis; Floods; Ecosystem-based adaptation

Friday, January 1, 2016

Expert Consensus on the Economics of Climate Change

Executive Summary
... Policymakers and journalists often portray economists as more conservative than scientists when it comes to climate policy, possibly due to their focus on market-driven adaptation and the costs of mitigation.

In an effort to clarify the level of consensus among economists with respect to climate change risks, economic impacts, and policy responses, we conducted a survey of expert economists.... We surveyed all those who have published an article related to climate change in a highly ranked, peer-reviewed economics or environmental economics journal since 1994. This survey allowed us to compare the views of economic experts to the views of the general public and help establish expert
consensus on the likely economic impacts of climate change and the recommended policy responses. The survey also  provides insights about the appropriate assumptions to use in “integrated assessment models” – the climate-economic models that many policymakers consult to inform climate policy decisions.

We designed a 15-question online survey with questions focused on climate change risks, economic damage estimates, and policy responses. We invited the 1,103 experts who met our selection criteria to participate, and we received 365 completed surveys. The survey data revealed several key findings:
• Experts on the economics of climate change expressed higher levels of concern about climate change impacts  than the general public, when asked identical survey questions.
• Economic experts believe that climate change will begin to have a net negative impact on the global economy very soon – the median estimate was “by 2025,” with 41% saying that climate change is already negatively affecting the economy.
• Respondents believe that numerous sectors of the U.S. economy will be harmed by climate change. 
A majority predicted negative impacts on agriculture (94%), fishing (78%), utilities (electricity, water, sanitation – 74%), forestry (73%), tourism/outdoor recreation (72%), insurance (66%), and health services (54%).
• More than three-quarters of respondents believe that climate change will have a long-term, negative impact on  the growth rate  of the global economy.
• More than 80% of experts believe that the United States may be able to strategically induce other nations to reduce their greenhouse gas emissions by first adopting policies to reduce U.S. emissions.
• Respondents overwhelmingly support unilateral emissions reduction commitments by the United States,  regardless of the actions other nations have taken (77% chose this option over alternatives such as committing  only if multilateral agreements are reached). 
File:Hurricane Sandy New Jersey Pier.jpg
Hurricane Sandy Damage Casino Pier, Seaside Heights, NJ http://tinyurl.com/z2ergj5
• The vast majority (75%) of respondents believe that the most economically efficient way for states
to comply with the U.S. Environmental Protection Agency’s “Clean Power Plan” carbon regulations
is through “market-based mechanisms coordinated at a regional or national level (such as a regional/ national trading program or carbon tax).”
• The discounting approach that the U.S. government currently uses to analyze climate regulations and other policies – a constant discount rate calibrated to market rates – was identified by experts as the least desirable approach for setting discount rates in the context of climate policies. Nearly half (46%) of respondents favored an approach that featured declining discount rates, while 44% favored using rates calibrated with ethical parameters.
• On average, economic experts predicted far higher economic impacts from climate change than the
estimates found in older surveys of economists and other climate experts. Respondents predicted a
global GDP loss of roughly 10% if global mean temperature increases by 3°C relative to the pre-industrial era by 2090 (this increase approximates a “business as usual” emissions scenario).
• Experts believe that there is greater than a 20% likelihood that this same climate scenario would lead to a “catastrophic” economic impact (defined as a global GDP loss of 25% or more).
• Our findings revealed a strong consensus (69%) that the “social cost of carbon” should be greater than or equal to the figure currently used by the U.S. government (only 8% believe the value should be lower).