Saturday, August 5, 2017

The Price of Climate Deregulation: Adding Up the Costs and Benefits of Federal Greenhouse Gas Emission Standards

Federal climate regulations are currently under attack, in part due to the perception that these regulations will impose excessive costs on regulated industries and society as a whole. But according to federal projections, the benefits of these regulations would significantly outweigh the costs. In a new paper, we added up the projected economic impacts of major federal rules aimed at reducing greenhouse gas emissions and found that the net benefits could reach nearly $300 billion per year by 2030. The rules will also generate a variety of non-monetized benefits, such as improved public health outcomes and the creation of jobs, as well as climate mitigation benefits that will extend well beyond 2030.

Jessica Wentz and Nadra Rahman analyzed the projected economic impacts of major regulations aimed at controlling carbon dioxide and methane: U.S. EPA’s Clean Power Plan, the Bureau of Land Management’s Methane and Waste Prevention Rule, EPA’s 2016 New Source Performance Standards for the oil and gas sector, and EPA’s emissions standards for both light-duty and heavy-duty vehicles.

Rahman and Wentz primarily aggregated EPA and Interior’s own cost-benefit projections of the Obama-era regulations. They also compared the values to separate cost-benefit analyses developed by independent researchers, a number of whom challenged the agencies’ analyses of the regulations, alternately stating that EPA and BLM had overestimated benefits or underestimated costs.
The $370 billion in gross benefits includes the positive impacts of reducing 980 million metric tons of carbon dioxide equivalent by 2030, along with the health benefits of also reducing other pollutants, such as nitrogen oxides.

These benefits would be four times greater than the projected $84 billion in total costs of implementing major regulations crafted under the Obama administration, said researchers in a paper published on the center’s website yesterday.

On a year-to-year basis, the economic benefits can either significantly exceed, or at the very least match, the cost of implementation. Some of the highest potential benefits come from implementing the Clean Power Plan and from standards for medium- to heavy-duty vehicles. The total does not include other benefits like job creation and long-term climate change mitigation benefits.

Clean Power Plan
Based on EPA’s estimates, the net economic benefits of the rule could be around $7 billion in 2020, and then rise to $46 billion in 2030.  These figures included: compliance costs, an estimated reduction of 74 million metric tons of CO2 emissions in 2020 and a reduction of 375 million metric tons in 2030. The dollar values also counted health benefits resulting from the reduction of other pollutants like sulfur dioxide and nitrogen oxides. The economic benefits don’t include other potential positives of the rule like avoided premature deaths, lower exposure to hazardous air pollutants and impacts on ecosystems.

The researchers note that the economic benefits are calculated using a social cost of carbon, a complex metric that puts a dollar value on the emission of 1 ton of carbon. The value takes into account how rising global temperatures will affect the planet and society. In the president’s “energy independence” executive order, Trump signaled that the administration would seek to alter this method of calculating the costs of climate change, though agencies could use a related metric that would only take into account domestic impacts of climate change.

Motor Vehicle Emissions
Light-duty vehicles: The fuel efficiency improvements alone for light-duty vehicles are enough to offset the costs of implementing rules on emissions from these vehicles, according to the EPA figures the researchers cited. The net economic benefits of fuel efficiency standards for model years 2012 to 2016 are expected to be $34.7 billion in 2020 and $100.4 billion in 2030. Meanwhile, standards for model years 2017 through 2025 could lead to net benefits of $168 billion in 2020 and $81.4 billion in 2030. Medium and heavy-duty vehicles: According to EPA data, phase one of emissions standards for these vehicles, for model years 2014 to 2018, could lead to net benefits of $10 billion in 2020 and $27.3 billion in 2030. Phase two, for model years 2019 to 2028, could have net benefits of $31.5 billion in 2020 and $74.4 billion in 2030.

New Source Performance Standards for the Oil and Gas Sector
As with the Clean Power Plan, EPA used the social cost of carbon metric to calculate the net monetary benefits of controlling methane, volatile organic compounds and toxic air pollutants emitted from new and modified sources. The net benefits of the rule could be $37 million by 2020 and go up to $180 million in 2025. These numbers consider compliance costs and methane emissions reductions of 300,000 short tons in 2020 and 510,000 short tons in 2025. Not all benefits were included. EPA did not put a dollar value on the health benefits of potential reductions in ozone, which is formed from volatile organic compounds. Estimates also did not include potential natural gas savings from captured methane.
...

By Nadra Rahman and Jessica Wentz
August 3rd, 2017       

It’s a Superfund Site, but It’s Also Their Livelihood - The New York Times

...
Alberto Rodriguez', Los Primos Auto Repair and Sale, is one of six businesses at the intersection of Cooper and Irving Avenues in Ridgewood, Queens, that have been targeted for demolition as part of a cleanup plan released recently by the Environmental Protection Agency. The businesses are within a Superfund site, the term for sites covered by a program that finances the cleanup of hazardous waste.

The small, triangle-shaped tract, hemmed in on one side by an abandoned rail spur, does not look particularly active...  But for business owners like Mr. Rodriguez, who have turned the block into a one-stop shop for automotive needs ... the proposed plan threatens to uproot well-established livelihoods.
...
Mr. Rodriguez’s shop sits atop land formerly occupied by the Wolff-Alport Chemical Company, which from the 1920s through the 1950s extracted metals from imported sand. In the process, the company produced waste containing two radioactive elements, thorium and uranium, which it disposed of by dumping the waste into sewers and perhaps also by burying it .......
https://cumulis.epa.gov/supercpad/cursites/csitinfo.cfm?id=0206479
The E.P.A. has been aware of radioactive contamination at the site since at least 1988, but it was not until 2014 that the agency assigned Superfund status to the site. Before then, the E.P.A. installed interim protections, including placing slabs of concrete, lead and steel beneath floors and sidewalks to block radiation from emanating upward.

Those measures wreaked havoc with Mr. Rodriguez’s business, he said. 
...
The demolition plans are not final. Another possibility raised in the plan is the demolition of just the vacant warehouse and the excavation of soil around the remaining buildings. That option would require government checkups every five years, the plan said, with maintenance costs “in perpetuity.”
...
The health risks from the radiation at the site are small, said Dr. David Brenner, the director of the Center for Radiological Research at Columbia University Medical Center, who reviewed the E.P.A.’s risk estimates at a reporter’s request. If no further remediation were done at the site, a future resident would see an increased risk of cancer of about 0.005 percent, the plan predicted.

Walter Mugdan, an acting deputy regional administrator for the E.P.A., acknowledged that the site’s tenants “are not in any significant danger at all.” But the agency’s goal, he said, is to ensure that the site can be used in the future, perhaps even for residential development.
...
Any demolition would not be undertaken until 2019 or 2020 at the earliest, Mr. Mugdan said. About two dozen Superfund sites are ready for cleanup at any given time, he said, but because of limited funding, usually work begins on only six to eight each year. The projected cost of the government’s preferred plan for the Wolff-Alport cleanup is more than $39 million.

The E.P.A. often seeks to hold companies responsible for the contamination financially accountable for the cleanup, but Wolff-Alport has been defunct for decades. Mr. Mugdan said his agency would try to determine if the company ever sold itself to any existing firms.

The protracted timeline for demolition offers small consolation to the site’s current tenants. “The rent is crazy. I can’t find a place like that,” said Mr. Rodriguez, who pays $3,600 a month in rent.... The E.P.A. will offer small businesses up to $25,000 to help them set up at another location....
...
FOR FULL STORY GO TO:
By VIVIAN WANG
The New York Times https://www.nytimes.com
August. 4, 2017

Also see

The Role of Logistics in Practical Levelized Cost of Energy Reduction Implementation and Government Sponsored Cost Reduction Studies: Day and Night in Offshore Wind Operations and Maintenance Logistics

Abstract: This paper reveals that logistics make up at least 17% of annual operational expenditure costs for offshore wind farms. Annual operational expenditure is found to vary by a factor of 9.5, making its share of levelized cost of energy for offshore wind range from 13% to 57%. These are key findings of a 20-month research project targeting cost reduction initiatives for offshore wind systems. The findings reveal that cost-out measures are difficult to implement due to cultural differences. Implementation efforts are rendered by personnel located offshore in a harsh sea environment which is in stark contrast to the shore-based office personnel who develop studies directing cost reduction efforts. This paper details the company motivation to join industry-wide cost reduction initiatives. A business case for offshore wind operations and maintenance logistics yielding 1% savings in levelized cost of energy is included on how to expand working hours from daytime to also work at night.
Calculated annual OpEx cost ranges per mega-Watt for the eleven studies.
Energies 10 00464 g002
Scenarios displaying fluctuations in Operating Expenditure share of total costs.
Energies 10 00464 g003
Selected business case impact on offshore wind farm levelized cost of energy
Energies 10 00464 g004

Friday, August 4, 2017

SWEPCO Announces Major Project To Secure Low-Cost, Renewable Energy for Customers

Southwestern Electric Power Co. (SWEPCO) today announced plans for a major clean energy project that will provide 6 million megawatt-hours (mWh) of new wind energy annually to SWEPCO customers. SWEPCO will file applications July 31 with utility regulators in Arkansas, Louisiana and Texas to request approval for the project.

As proposed, SWEPCO will own 1,400 megawatts (MW) of a 2,000-MW wind farm under construction in Oklahoma. SWEPCO also will help build an approximately 350-mile, dedicated 765-kilovolt (kV) power line from the Oklahoma Panhandle to Tulsa to deliver the wind energy to customers.
...

The proposed Wind Catcher Energy Connection Project is expected to save SWEPCO customers more than $5 billion, net of cost, over the 25-year life of the wind farm, compared to projected market costs for procuring power over the same period.

Cost savings include no fuel cost for wind, which lowers SWEPCO’s overall fuel and purchased power costs; full value of the federal Production Tax Credit, which is available for construction of new wind farm projects; and the cost-efficient delivery of the wind generation to customers through the new, dedicated power line.
Customers will see savings primarily through a reduction in the fuel portion of their bills, beginning in 2021.

Public Service Company of Oklahoma (PSO), also a subsidiary of American Electric Power (NYSE: AEP), will own 600 MW of the same wind power plant and co-own the proposed power line, pending regulatory approval.

SWEPCO’s 70 percent share of the $4.5 billion Wind Catcher project is $3.2 billion.

If we keep subsidizing wind, will the cost of wind energy go down? [ The Conversation

As more wind turbines have been put in place, the cost of wind energy has gone down

There are high hopes for renewable energy to help society by providing a more stable climate, better energy security and less pollution. Government actions reflect these hopes through policies to promote renewable energy. In the U.S. since 1992 there’s been a federal subsidy to promote wind energy, and many states require electricity utilities to use some renewable energy.

But when is the right time to stop government support for an energy technology?

This is a timely question: Rick Perry’s Department of Energy is currently working on a grid reliability report that many expect to argue that wind and solar cause reliability problems because they don’t supply power continually. A conclusion like this can be used to justify removal of government subsidies or regulations favoring other sources of energy.

Subsidies need not last forever – there can come a time when its objective has been achieved or experience suggests the subsidy is not working as intended.

Is it time to end subsidies for wind? A big part of the answer to this question lies in whether subsidies are actually making wind cheaper.

Why subsidize energy technology

The justification for subsidizing a given technology is that it delivers public benefits that outweigh the subsidy cost. If a technology shows promise to become cheap enough, the subsidy can be viewed as a temporary stimulus to bring it a point where it can stand on its own.

For example, in the early days of the semiconductor industry, integrated circuits were too expensive for consumer markets. Government demand for military applications provided a critical bridge to bring down costs and activate broader markets.

On the other hand, subsidizing an emerging technology that has trouble bringing down costs may be inefficient. For decades, the U.S. government has subsidized or mandated production of corn ethanol. Yet ethanol is still not market-competitive, at least not with recent crude oil prices.

Wind power’s ‘learning curve’

The price for wind power has gone down over the years, but how cheap is it getting? There is a surprisingly diverse set of answers to this question. There are over 100 existing studies of wind cost trends, with results ranging from wind power becoming more expensive over time to becoming cheaper so quickly that it will soon be cheaper than fossil fuels. Curiously enough, while researchers have recently started to note disparities between studies, no one has yet grappled with explaining and reducing such variability. This is, unfortunately, a common situation in many research domains: Various groups get conflicting results from similar analyses, but no one works on understanding why these differences arise.

In a recent paper, we sought to better understand cost reductions in wind power by finding patterns in historical trends.

Wind costs follow what economists call a learning curve: For every doubling of wind production, the cost goes down by a fixed percentage. For example, if the price of electricity from wind is 10 cents per kilowatt-hour with a given number of wind farms, a 10 percent “learning rate” means that wind electricity would cost 10 percent less, or 9 cents per kilowatt-hour, if one doubles the number of wind farms.


Our main finding was that the learning rate for wind power is in the range of 7.7 percent to 11 percent. That means if more wind power is installed and the cost of energy continues to decline as it has in recent years, the cost of generating electricity with wind will fall from 5.5 cents/kilowatt-hour today to 4.1–4.5 cents/kilowatt-hour in 2030.

Previous studies obtained learning rates from -3 percent to +33 percent, the minus sign indicating wind becoming more, rather than less, expensive over time. Why are the results so different? We showed that one can get very different outcomes depending on the method and data range used.

First, we believe it is important to account for wind power costs in terms of the total cost to generate electricity. Many prior studies measured wind cost as the price to build the capacity to make electricity at peak wind times. But this is a poor measure because much of the progress in wind technology in recent years has been to generate more power when the wind is weaker.
https://www.flickr.com/photos/130749842@N07/16328618272/
Secondly, it is important to treat wind power as a global industry. The adoption of wind in one country helps the industry develop and grow so that wind becomes cheaper in other countries. Modeling wind adoption in only one nation can skew results.

Finally, results depend strongly on the date range of data used. Even with an identical method, the estimated learning rate can change up to 10 percent depending on which years of data you use.

To subsidize or not to subsidize?

So if wind costs will fall to 4.1–4.5 cents/kilowatt-hour in 2030, as we found, what does this mean for wind subsidies? The U.S. Energy Information Agency projects the cost of natural gas and coal power in 2030 will be 4.5 and 5 cents per kilowatt-hour respectively. Taking these numbers at face value, wind is on track to become cheaper than fossil fuels as a source of electricity.

Wednesday, August 2, 2017

Valuing the resilience dividend: A new way forward | Zilient

Over the past decade, the notion of resilience has emerged as a prevailing paradigm for planning that considers how people and places can survive, adapt, and grow in the face of today’s pressures, where globalization, urbanization, and climate change have combined to increase our vulnerability to a range of shocks and stresses.

Given the tremendous interest in and commitment to building resilience, we need tools that help communities illustrate and quantify the link between resilience-inspired investments and improved well-being.

The net benefits from these investments are the resilience dividend.

Building resilience is about people and places being better prepared to withstand catastrophic events—both natural and manmade—and able to recover more quickly and emerge stronger when those events occur. It may also provide additional benefits even in the absence of those events.

The resilience dividend is the sum of benefits, over time, from a project investment based on resilience principles compared to one that is not.

It is the difference in value between a resilience approach and business-as-usual - the “bonus” we receive from investing in a project designed to build resilience.

The Rockefeller Foundation, which has invested more than half a billion dollars in resilience-building over the past decade, received an overwhelming number of requests for how to quantify the resilience dividend.

With support from the Foundation, the RAND Corporation developed the “Resilience Dividend Valuation Model”, a framework that provides communities with a structured way to frame and analyze resilience policies and projects.


The Resilience Dividend Valuation Model combines elements of project evaluation and economic valuation, and can be used to guide decision-making, planning, and action for resilience investments.
It offers a framework for policy makers and practitioners to carefully map out how a resilience investment will affect a community and its well-being.

It helps stakeholders understand and illustrate the causal relationships between elements of human and natural systems that are unavoidably complex and evolve over time.
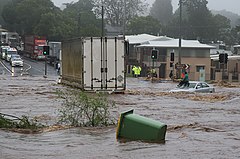
Trapped woman on a car roof during flash flooding in Toowoomba 2.jpg
https://en.wikipedia.org/wiki/2010%E2%80%9311_Queensland_floods
It assesses how resilience investments will shape outcomes and how valuable these outcomes might be to stakeholders that operate within the system. This mapping provides the basis for estimating the net benefits of the investment.

What do communities gain from adopting resilience approaches?

There are two main benefits from resilience approaches:
  1. lower future costs from a shock (or set of shocks) or stressors; and
  2. social, economic and environmental co-benefits even in the absence of a shock or stress. Co-benefits include enhanced social cohesion, better environmental quality and ecosystem services, and additional public goods (for example, space for public use).
Valuing the additional benefits from a resilience project requires that we understand how resilience policy and program interventions change the vital elements of a system over time.

These elements include the resources a community has, the goods and services those resources provide, and how those goods and services drive the level of well-being. It also requires an understanding of how stakeholders in the system might behave in response to changes in system elements.

Resilience investments can change the resources a community has, relax constraints, or increase opportunities for stakeholders.

The linkages between elements of a system are critical, since they can be leveraged to create additional co-benefits and complementarities.

The RAND team completed a series of case studies designed to both demonstrate how the Resilience Dividend Valuation Model can be applied, and to draw out lessons learned about the challenges and opportunities of estimating the resilience dividend.

One of the case studies looked at investments in climate adaptive infrastructure and social systems in eight towns in Bangladesh.

The goal of these investments, which was co-financed by the Asian Development Bank (ADB), was to improve long-term outcomes related to natural disasters by investing in physical infrastructure, supporting community decision-making, and enhancing municipal government capacity through a multi-year project.

Although the Bangladesh projects are not yet complete, RAND applied the Resilience Dividend 

Valuation Model using a pre-project approach to estimate the expected resilience dividend.

Using ADB data, RAND analyzed the goods and services the projects will produce, ranging from water quality and flood protection to general economic activity and municipal services, and the team looked at how those goods and services will be allocated, including through gender-inclusive decision making.

Estimating the full resilience dividend required more data than was available, yet the case highlighted the opportunities for using the model to gauge the potential impacts of resilience investments.

The Foundation’s support to RAND resulted in a modeling framework that offers us a starting point – one that can be built upon through collective expertise, as well as trial-and-error.

We’ve learned a lot from trying to estimate the resilience dividend of an investment and have concluded that quantifying the resilience dividend of an investment: 
  • Is a skill and an iterative process, not an equation or a black box.
  • Takes rigorous systems analysis, and is challenging especially when there is no shock.
  • Is a data- intensive endeavor: quantitative and qualitative data are critical to arriving at an estimation of the dividend.
  • Demands capturing critical elements beyond economic and financial benefits: social capital, for example, is important for behavior change within a system and critical to valuing the dividend.
  • Requires a careful study of distributional effects: a positive resilience dividend does not necessarily imply positive net benefits for all stakeholders.
The RAND team, in conjunction with Rockefeller, produced two documents to support those looking to implement the Resilience Dividend Valuation Model.

The Practitioner Guide walks through the motivation and mechanics of the model to introduce the framework and approach.

A more detailed report, including technical explanations, is available for those interested in delving deeper into the approach and features six detailed case studies designed to explain how the model can be applied across settings, as well as the opportunities and challenges of calculating the resilience dividend. 

by Sundaa Bridgett-Jones, Senior Associate Director, The Rockefeller Foundation
August 2, 2017