Friday, January 10, 2020

Urban trees, house price, and redevelopment pressure in Tampa, Florida

Abstract
We examined the relationship between urban trees and the sales price of single-family homes in Tampa, Florida. We chose Tampa, because the city is facing major redevelopment pressure that may impact the association between trees and house price. In particular, a frequently voiced view in Tampa’s development community is that trees adversely affect the value of houses that are being sold for redevelopment. We estimated hedonic models of sales price controlling for house and neighborhood characteristics and correcting for spatial autocorrelation (n = 1,924). We found that trees within 152m (500 feet) of a house’s lot were significantly associated with higher sales prices. Specifically, a 1-percentage point increase in tree-canopy cover was associated with a total increase in sales price of $9,271 to $9,836 (results were largely insensitive to correction for spatial autocorrelation). Our results demonstrate that, even in a city facing major redevelopment pressure, trees are associated with higher sales prices.

Highlights
• Trees on or right next to a house’s lot are not associated with higher sales price.
• In contrast, houses with more neighborhood trees sell for a price premium.
• Despite redevelopment pressure, trees are a neighborhood amenity.

 
https://www.tampagov.net/sites/default/files/parks-and-recreation/files/purple_tab_bg.pdf
by Geoffrey H. Donovan 1, Shawn Landry 2 and Cody Winter 3
1. USDA Forest Service, PNW Research Station, 620 SW Main, Suite 502, Portland, OR, 97205, USA
2. University of South Florida, School of Geosciences, 4202 E Fowler Ave., NES107, Tampa, FL, 33620, USA
3. Environmental Protection Commission, 3629 Queen Palm Drive, Tampa, FL, 33619, USA
Urban Forestry & Urban Greening via Elsevier Science Direct www.ScienceDirect.com
Volume 38; February, 2019; Pages 330-336

Wednesday, January 8, 2020

Moral Hazard, Wildfires, and the Economic Incidence of Natural Disasters

Abstract:
This study measures the degree to which large public expenditures on wildfire protection subsidize development in harm's way. Using administrative firefighting data, we calculate geographically-differentiated implicit subsidies to homeowners throughout the western USA. We first examine how the presence of homes affects firefighting expenditures. These results are used to reconstruct the implied historical cost of protecting each home and to perform an actuarial calculation of expected future protection cost. The expected net present value of this subsidy can exceed 20% of a home's value. It increases with fire risk and decreases surprisingly steeply with development density. A simple model is used to explore effects on expansion of developed areas, density, and private risk-reducing investments. These results demonstrate how policy and institutions influence the costs imposed by a changing climate.
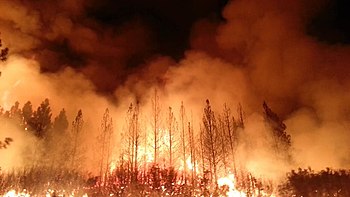
The Rim Fire burned more than 250,000 acres (1,000 km2) of forest near Yosemite National Park, in 2013https://en.wikipedia.org/wiki/Wildfire
...
During 1985–2017 total wildfire property damages in the United States were $51 billion, while direct firefighting costs for federal agencies alone totaled $43 billion.
...
A sample of homes including all 8.6 million homes in the western US located near areas of wildland vegetation (44% of all western US residential homes, condos, and apartments)....The range of historical protection costs is large. The average net present value ranges from a few hundred dollars per home for the lowest-cost cells to almost $100,000 per home in the highest-cost cells.
...
Using the “suppression only” measure, 50% of WUI homes have expected protection costs under $500, while the highest-risk homes have costs that are much larger. Five percent of homes have expected costs exceeding $3,800. One percent of homes have expected protection costs exceeding $12,700. Using the “suppression plus” measure results in higher costs. The 95th and 99th percentiles of this distribution are about twice as high as for the “suppression only” measure.
...
In 2014, California began requiring homeowners in the Cal Fire protection area to pay an equal annual fee of about $150 per year. The fee proved unpopular among homeowners and was suspended in 2017. This study shows that such a fee would need to be much more geographically differentiated in order to correct incentives (as opposed to simply raising revenue). Another lesson from this study is that exempting owners of existing homes could increase the political acceptability of such a policy without reducing its effectiveness, since the protection costs we estimate are not generally high enough to justify abandonment of existing homes. An alternative would be to assign firefighting costs to local governments, which would recover them through property taxes or other measures. This approach would incentivize cities and counties to consider fire protection costs in zoning, land use, and building codes/


https://www.nber.org/papers/w26550
by Patrick Baylis and Judson Boomhower
National Bureau of Economic Research (NBER) www.NBER.org
NBER Working Paper No. 26550; Issued in December 2019

The Private and External Costs of Germany's Nuclear Phase-Out

Abstract:
Many countries have phased out nuclear electricity production in response to concerns about nuclear waste and the risk of nuclear accidents. This paper examines the impact of the shutdown of roughly half of the nuclear production capacity in Germany after the Fukushima accident in 2011. We use hourly data on power plant operations and a novel machine learning framework to estimate how plants would have operated differently if the phase-out had not occurred. We find that the lost nuclear electricity production due to the phase-out was replaced primarily by coal-fired production and net electricity imports. The social cost of this shift from nuclear to coal is approximately 12 billion dollars per year. Over 70% of this cost comes from the increased mortality risk associated with exposure to the local air pollution emitted when burning fossil fuels. Even the largest estimates of the reduction in the costs associated with nuclear accident risk and waste disposal due to the phase-out are far smaller than 12 billion dollars.

by Stephen Jarvis, Olivier Deschenes and Akshaya Jha
National Bureau of Economic Research (NBER) www.NBER.org
NBER Working Paper No. 26598; Issued in December 2019

Looking Back at Fifty Years of the Clean Air Act - After major expansion in 1970, the Clean Air Act led to substantial emissions reductions and health improvements—as well as some unintended consequences.

Abstract
Since 1970, transportation, power generation, and manufacturing have dramatically transformed as air pollutant emissions fell significantly. To evaluate the causal impacts of the Clean Air Act on these changes, we synthesize and review retrospective analyses of air quality regulations. The geographic heterogeneity in regulatory stringency common to many regulations has important implications for emissions, public health, compliance costs, and employment. Cap-and-trade programs have delivered greater emission reductions at lower cost than conventional regulatory mandates, but policy practice has fallen short of the cost-effective ideal. Implementing regulations in imperfectly competitive markets have also influenced the Clean Air Act’s benefits and costs.
  • Spatially varying regulations can impose substantial costs on local economies.
  • Current applications of market-based mechanisms may fall short of cost-saving expectations.
  • Varying fuel content regulations across the United States may impose unnecessary costs on consumers in separated markets.
  • Regulatory flexibility for fuel content rules doesn’t always yield cost-effective results.
  • Unanticipated costs arising from overly optimistic technology projections are an important issue in the design of renewable fuel requirements.
The SO2 program has been subject to extensive research, with a number of papers focusing on the early years (such as Carlson et al. 2000 and Ellerman et al. 2000) and some recent synthesis and review papers which combine ex-ante and ex-post papers (such as Schmalensee and Stavins 2013). The ex-ante analyses all suggest large cost savings based on a comparison of the least cost solution of achieving the cap to the command-and-control uniform performance standard case. Carlson et al. (2000) note that this cost reduction reflected dramatic declines in their estimated marginal abatement cost functions for sulfur dioxide emissions resulting from changes in technology and low-sulfur coal prices over 1985-1995.

The only true ex post study of the program’s benefits and costs is by Chan et al. (2018), which finds much smaller cost savings than predicted ex ante. In part, this is the result of decisions of several power plants—in concert with their state public utility commissions—to install scrubbers rather than comply by purchasing allowances and/or using low sulfur coal, a decision that Chan et al. estimate increased annual compliance costs by nearly $100 million. Focusing on 2002 as a Phase II year before the transition to a period of regulatory uncertainty and using a mixed logit model of the firm’s compliance decision, the authors find that the SO2 program reduced compliance costs by about $200 million (1995$) and increased public health benefits by roughly $170 million. Chan et al. examine a performance standard that delivers the same aggregate emission outcome as the Acid Rain Program in 2002, which had much higher emissions than the cap due to use of banked allowances. Thus, the cost-savings of the two instruments may be smaller than they would have been under the statutory cap for 2002. Chan et al. also find that the prevailing pattern of allowance trading— from western generating units in sparsely populated areas to eastern generating units in more densely populated areas—increases public health damages by about $2 billion relative to a no-trade counterfactual.
...
The Chan et al. paper builds on the insights in Muller and Mendelsohn (2009), which illustrated through an integrated assessment model how the location of an emission source relative to a downwind population could dramatically affect the monetized damages of a ton of sulfur dioxide emitted at that source. In their counterfactual analyses, Muller and Mendelsohn estimated that trading ratios, based on the relative damages associated with a ton of emissions for a pair of locations, could improve social welfare by nearly $1 billion per year compared to the ton-for-ton trading in the SO2 program as implemented. However, such differentiation in cap-and-trade implementation raises questions about administrative feasibility and accuracy in estimating ratios, especially in the presence of a complicated atmospheric chemistry that could induce negative ratios for NOx (Fraas and Lutter 2012). 
...
While overall coal prices fell during the latter half of the 1990’s, Busse and Keohane found that delivered prices rose for plants covered by Phase I of the SO2 cap-and-trade program relative to those still operating under command-and-control regulation, and prices rose more at plants near a low-sulfur coal source. Overall, they estimate that railroads enjoyed an increase in annual producer surplus of more than $40 million, which represented about 15 percent of the economic surplus created by the cap-andtrade program....

Tuesday, January 7, 2020

From Fog to Smog: the Value of Pollution Information

Abstract:

During 2013-2014, China launched a nation-wide real-time air quality monitoring and disclosure program, a watershed moment in the history of its environmental regulations. We present the first empirical analysis of this natural experiment by exploiting its staggered introduction across cities. The program has transformed the landscape of China's environmental protection, substantially expanded public access to pollution information, and dramatically increased households' awareness about pollution issues. These transformations, in turn, triggered a cascade of behavioral changes in household activities such as online searches, day-to-day shopping, and housing demand when pollution was elevated. As a result, air pollution's mortality cost was reduced by nearly 7% post the program. A conservative estimate of the annual benefit is RMB 130 billion, which is at least one order of magnitude larger than the cost of the program and the associated avoidance behavior. Our findings highlight considerable benefits from improving access to pollution information in developing countries, many of which are experiencing the world's worst air pollution but do not systematically collect or disseminate pollution information.
Beijing air on a 2005-day after rain (left) and a smoggy day (right) https://en.wikipedia.org/wiki/Pollution_in_China
https://www.nber.org/papers/w26541
by Panle Jia Barwick, Shanjun Li, Liguo Lin and Eric Zou
National Bureau of Economic Research (NBER) www.NBER.org
NBER Working Paper No. 26541; Issued in December 2019

Lead Pipes, Prescriptive Policy and Property Values

Abstract:
Several recent incidences of severe waterborne lead exposure have public authorities and communities across the US rethinking their strategies to address aging water infrastructure. One common question: who should pay for updates? This paper provides evidence of positive property value capitalization effects following remediation of private lead service lines in Madison, WI. Using a 16-year panel of property transactions data and a universal and prescriptive policy change, I identify an average post-replacement price effect on the order of 3–4% of a property’s value. This implies a more than 75% average return on public and private remediation costs, suggesting homeowners strongly value the benefits of lead reduction in publicly supplied drinking water.
Image result for lead in water
https://news.fordham.edu/science/lead-water-and-6-things-you-can-do/
by Adam Theising, Department of Agricultural and Applied Economics, University of Wisconsin-MadisonMadisonUSA
Environmental and Resource Economics via Springer Link www.SpringerLink.com
November, 2019; Volume 74, Issue 3, pages 1355–1382|