Seven Independent System Operators (ISOs) or Regional Transmission Operators (RTOs) serve close to 70 percent of all United States electricity consumers. One region of the country, the Southeast, is particularly devoid of this type of market competition. This report details the impacts of enhancing competition for wholesale electricity transactions through a theoretical organized market in the Southeast region. We use a combined production-cost and capacity expansion model of the electric power system in seven Southeastern states (Alabama, Florida, Georgia, Mississippi, North Carolina, South Carolina, and Tennessee) out to 2040. ...
We find that a competitive Southeastern RTO creates cumulative economic savings of approximately $384 billion by 2040 compared to the business-as-usual (BAU) case. In 2040, this amounts to average savings of approximately 2.5¢ per kilowatt-hour (kWh), or 29 percent in retail costs compared to BAU. 2040 retail costs in the RTO scenario are 23 percent below today’s costs. In the RTO Scenario, carbon emissions fall approximately 37 percent relative to 2018 levels, and 46 percent compared to the IRP Scenario, in which emissions increase. Other major criteria pollutants impacting human health, such as NOX, SO2, and PM2.5, drop dramatically, largely as a result of eliminated coal generation. Emissions gains are driven by a vast deployment of renewable energy resources replacing coal.
Employment benefits begin accruing immediately after the RTO comes into operation, as lost jobs in coal and natural gas generation are replaced by construction jobs related to wind, solar, and battery deployment. By 2040, the RTO scenario creates 285,000 more jobs relative to the business-as-usual scenario, owing to the construction of 62 gigawatts (GW) of solar, 41 GW of onshore wind, and 46 GW of battery storage.
Our BAU case relies on the Integrated Resource Plans of the major investor-owned utilities in these states, in which utilities prescribe a coordinated set of new generating and transmission capacity necessary to meet future load projections. Vibrant Clean Energy’s WIS:dom®-P model then optimizes operations for these projected resource additions and retirements based upon historical dispatch estimates, assuming no further public policy intervention. In this case, the model assumes that each utility must meet its specified load projections and planning reserve margins independently, assuming limited import/export capacity from neighboring utilities and limited transmission expansion.
We compare this scenario to a fully competitive wholesale electric market, in which an RTO administered open market determines the most cost-effective capacity mix and resource dispatch, regardless of where that generation is located or who owns it. The RTO scenario assumes an integrated transmission planning scheme in which all seven Southeastern states share resources and expand transmission in order to meet one regional planning reserve margin at least cost. The competitive RTO Scenario modeled here grants planners and operators in the region the opportunity to co-optimize generation, distribution, and transmission benefits while planning to meet capacity in the most economically efficient way.
A companion policy report additionally details key policies to help achieve competition’s benefits in the Southeast region. We focus on incremental policies that introduce competition into regional dispatch and utility resource planning and procurement. We cover principles for market design to help ensure a regional market is compatible with a cost-effective variable resource mix.
We outline policies that enable regional utilities with net-zero carbon goals to meet those goals effectively while respecting and supporting the fossil-dependent communities that supported economic development in the region.
Despite the fact that new renewable energy and battery storage resources are the least-cost forms of generating electricity, the Southeast region is largely beholden to monopoly utilities that rely on existing coal fleets and new gas-fired power plants to meet consumer electricity needs. This report finds that these utilities continue to inefficiently plan the power grid at great expense to consumers. Wasted excess capacity leads to wasted consumer dollars while stifling clean energy deployment, employment gains, and public health benefits.
Policymakers considering a regional market or state-level competitive procurement should be encouraged by this analysis to keep pressing in legislative and regulatory forums. State stakeholders where utilities block competitive reforms now have new quantitative findings to challenge the assumption that the way utilities have traditionally done business is in the public’s best interest.
By Eric Gimon and Mike O'Boyle, Taylor McNair, Christopher T M Clack, Aditya Choukulkar, Brianna Cote and Sarah McKee
"To Rid The Grid Of Coal, The Southeast U.S. Needs A Competitive Wholesale Electricity Market" by Sarah Spengeman in Forbes on August 23, 2020 https://tinyurl.com/y67co45m notes that:
The Southeastern United States, one of the country’s only regions without a competitive wholesale electricity market, is dominated by monopoly utilities, which have favored expensive and polluting fossil fuel generation over cheap clean energy. Nearly all Southeast coal plants cost more to run than replacing them with new wind and solar, so continuing to run these uneconomic resources forces customers to foot the bill and inhale dirty air. ...
Competitive wholesale electricity markets, or Regional Transmission Operators (RTOs) and Independent System Operators (ISOs), are public-benefit corporations serving 70% of U.S. electricity customers that arose from electricity restructuring during the late 1990s-early 2000s to cut costs and encourage innovation.
Competition in these markets has reduced wholesale energy costs while creating an entry point for low-cost renewable energy to provide power to the grid. They have also been critical to integrating variable renewable energy – wind and solar – and capitalizing on resource diversity over larger geographical areas. ...
Despite ambitious long-term climate announcements, Southeast utilities are still heavily reliant on expensive-to-run coal plants and are doubling down on risky new gas infrastructure investments, instead of clean technologies of the future. ...
Comparing a competitive regional Southeast market through 2040 to a business-as-usual scenario based on existing monopoly utility Integrated Resource Plans reveals remarkable findings. Introducing a Southeast regional competitive market that optimizes regional transmission and shares resources (key features of other RTOs) would save $384 billion dollars with approximately $17.4 billion average yearly savings through 2040 - 23% lower electricity costs compared to today.
These enormous savings come from cheaper wind, solar, and storage displacing more expensive-to-run coal, along with an RTO-led regional transmission planning scheme where all seven states share power resources and expand transmission to most efficiently meet regional electricity demand. VCE’s WIS:dom model also incorporates electricity distribution infrastructure savings from deploying distributed storage and solar resources.
The Bar graph above shows cost reductions reach nearly 32% by 2040 in the competitive scenario compared to just 10% compared to business-as-usual.
In contrast, the current utility-led planning regime is an inefficient patchwork system. Monopoly utilities plan their electric grids independently from their neighbors and impose fees called “wheeling charges” to ship power across successive utility transmission systems. This incentivizes monopolies to over-build power plants, thereby increasing profits for their shareholders. Together, this significant duplication and overbuild of infrastructure costs customers billions....
An online data explorer https://energyinnovation.org/2020/08/25/southeast-wholesale-electricity-market-rto-online-data-explorer/ allows users to compare scenarios and understand state-level impacts:
This paper considers the treatment of co-benefits in benefit-cost analysis of federal air quality regulations. Using a comprehensive data set on all major Clean Air Act rules issued by the Environmental Protection Agency over the period 1997-2019, we show that (1) co-benefits make up a significant share of the monetized benefits; (2) among the categories of co-benefits, those associated with reductions in fine particulate matter are the most significant; and (3) co-benefits have been pivotal to the quantified net benefit calculation in exactly half of cases. Motivated by these trends, we develop a simple conceptual framework that illustrates a critical point: co-benefits are simply a semantic category of benefits that should be included in benefit-cost analyses. We also address common concerns about whether the inclusion of co-benefits is problematic because of alternative regulatory approaches that may be more cost-effective and the possibility for double counting.
The EPA regulatory program consistently delivers the greatest monetized benefits and imposes the largest costs of any federal regulatory agency’s actions (e.g., OMB 2019). To provide context for an assessment of co-benefits, Figure 2 illustrates the net social benefits for the CAA regulations in our database. The median rule has about $4.1 billion in net social benefits, based on the average of the lower and upper bounds of benefits and costs for that regulation’s snapshot of a full-implementation year. Every rule has positive net social benefits, with five exceptions: (1) the 1997 NAAQS for ozone (RIN 2060-AE57), with an estimated -$6 billion in net social benefits; (2) the 1997 medical waste incinerator standards (RIN 2060-AC62), with an estimated -$125 million in net social benefits; (3) the 2008 NAAQS for lead (RIN 2060-AN83), with an estimated -$90 million net social benefits15; (4) the 2005 mercury power plant rule (RIN 2060-AJ65), with an estimated -$1 billion in net social benefits; and (5) the 2016 new source performance standards for methane at oil and gas operations (RIN 2060-AS30), with an estimated -$200 million in net social benefits.
We find that co-benefits account for about 46 percent of the monetized benefits on average across all RIAs. As Figure 3 illustrates, this average masks considerable heterogeneity among the rules. Some rules have no monetized co-benefits, such as the 2013 fine PM NAAQS and the 2014 Tier 3 motor vehicle and emissions standards, which targeted both fine PM and ozone. Other rules, especially several of those focused on HAPs, have zero monetized benefits for the targeted pollutant. In these cases, fine PM pollution reductions are the primary, if not exclusive, source for monetized benefits. For the three joint EPA-NHTSA regulations targeting carbon dioxide emissions and fuel economy (RINs 2060-AP61, 2060-AQ54, and 2060-AS16), we consider reduced fuel costs one of the target benefits of the regulation, given NHTSA’s statutory authority. If, however, we were to consider reduced fuel costs a co-benefit from the standpoint of EPA under its Clean Air Act authority, then about $130 billion of benefits over 2011-2016 would shift and several of the dark gray bars at the bottom of Figure 3 would fall substantially.
by Joseph E. Aldy, Matthew Kotchen, Mary F. Evans, Meredith Fowlie, Arik Levinson and Karen Palmer
Policy makers often express concern about the impact of carbon taxes on employment and GDP. Focusing on European countries that have implemented carbon taxes over the past 30 years, we estimate the macroeconomic impacts of these taxes on GDP and employment growth rates for various specifications and samples. Our point estimates suggest a zero to modest positive impact on GDP and total employment growth rates. More importantly, we find no robust evidence of a negative effect of the tax on employment or GDP growth. We examine evidence on whether the positive effects might stem from countries that used the carbon tax revenues to reduce other taxes; while the evidence is consistent with this view, it is inconclusive. We also consider the impact of the taxes on emission reductions and find a cumulative reduction on the order of 4 to 6 percent for a $40/ton CO2 tax covering 30% of emissions. We argue that reductions would likely be greater for a broad-based U.S. carbon tax since European carbon taxes do not include in the tax base those sectors with the lowest marginal costs of carbon pollution abatement. ...
Figure 3 shows the IRF (Impulse Reponse Function) for the LP (Local Projection) model for real GDP, estimated using all 31 countries over the full 1985‐2018 sample, where the carbon tax rate is interacted with the share of emissions covered by the tax. Figure 3a shows results from the unrestricted model, that is, the model that allows for a nonzero long‐term effect of the tax on GDP growth. The predicted effect is positive in each year through year 6 except for year 4. In no year, however, is the effect significant at the 5% level (in most years it is within one standard error of zero). The results for the restricted model (figure 3b), in which a zero long‐term effect of the tax rate on GDP growth is imposed, are similar to those for the unrestricted model. Again, the point estimate is generally no more than one standard deviation away from zero.
Figure 4 shows the IRFs for the SVAR (Structural Vector AutoRegression) model. The unrestricted IRF (figure 4a) is always positive and near constant at about 0.4 percentage points.
...
Figure 6 shows IRFs for total employment. In both the unrestricted and restricted cases, employment initially rises and then subsequently falls. The cumulative impact (Figure 7) is positive over a six year period with a point estimate of 1.15 percentage points in the unrestricted LP model and 0.35 percentage points in the restricted model. In neither model do we reject a zero cumulative impact. Results (in the Appendix) for manufacturing employment are similar to total employment but the estimates are less precise. As with GDP, we can reject significant negative employment impacts from the carbon tax.
Abstract: This paper develops the first globally comprehensive and empirically grounded estimates of mortality risk due to future temperature increases caused by climate change. Using 40 countries' subnational data, we estimate age-specific mortality-temperature relationships that enable both extrapolation to countries without data and projection into future years while accounting for adaptation. We uncover a U-shaped relationship where extreme cold and hot temperatures increase mortality rates, especially for the elderly, that is flattened by both higher incomes and adaptation to local climate (e.g., robust heating systems in cold climates and cooling systems in hot climates). Further, we develop a revealed preference approach to recover unobserved adaptation costs. We combine these components with 33 high-resolution climate simulations that together capture scientific uncertainty about the degree of future temperature change. Under a high emissions scenario, we estimate the mean increase in mortality risk is valued at roughly 3.2% of global GDP in 2100, with today's cold locations benefiting and damages being especially large in today's poor and/or hot locations. Finally, we estimate that the release of an additional ton of CO2 today will cause mean [interquartile range] damages of $36.6 [-$7.8, $73.0] under a high emissions scenario and $17.1 [-$24.7, $53.6] under a moderate scenario, using a 2% discount rate that is justified by US Treasury rates over the last two decades. Globally, these empirically grounded estimates substantially exceed the previous literature's estimates that lacked similar empirical grounding, suggesting that revision of the estimated economic damage from climate change is warranted.
Time series of projected mortality risk of climate change. All lines show mortality effects of climate change across all age categories and are represented by a mean estimate across a set of Monte Carlo simulations accounting for both climate model and statistical uncertainty.
by Tamma A. Carleton, Amir Jina, Michael T. Delgado, Michael Greenstone, Trevor Houser, Solomon M. Hsiang, Andrew Hultgren, Robert E. Kopp, Kelly E. McCusker, Ishan B. Nath, James Rising, Ashwin Rode, Hee Kwon Seo, Arvid Viaene, Jiacan Yuan and Alice Tianbo Zhang National Bureau of Economic Research www.NBER.org NBER Working Paper No. 27599; Issued in July 2020
The Paris Climate Agreement aims to keep temperature rise well below 2 °C. This implies mitigation costs as well as avoided climate damages. Here we show that independent of the normative assumptions of inequality aversion and time preferences, the agreement constitutes the economically optimal policy pathway for the century. To this end we consistently incorporate a damage-cost curve reproducing the observed relation between temperature and economic growth into the integrated assessment model DICE [ Dynamic Integrated Climate-Economy model]. We thus provide an inter-temporally optimizing cost-benefit analysis of this century’s climate problem. We account for uncertainties regarding the damage curve, climate sensitivity, socioeconomic future, and mitigation costs. The resulting optimal temperature is robust as can be understood from the generic temperature-dependence of the mitigation costs and the level of damages inferred from the observed temperature-growth relationship. Our results show that the politically motivated Paris Climate Agreement also represents the economically favourable pathway, if carried out properly.
...
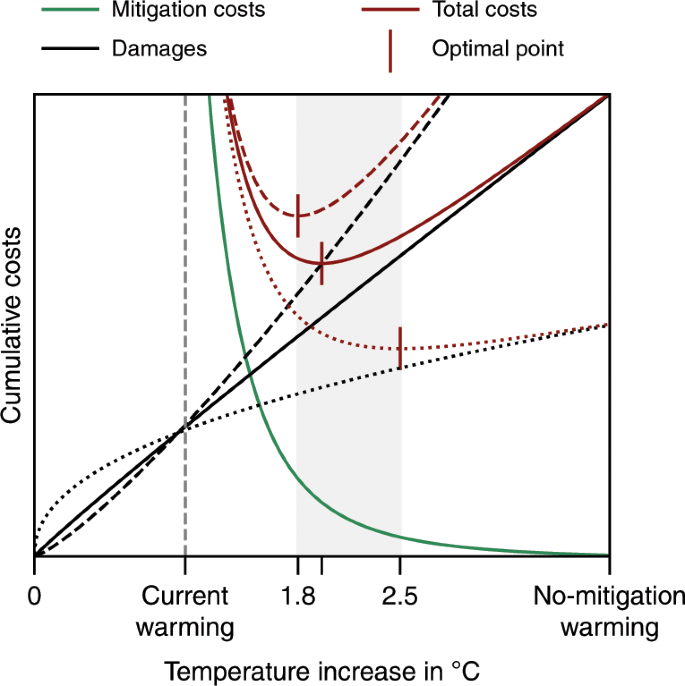
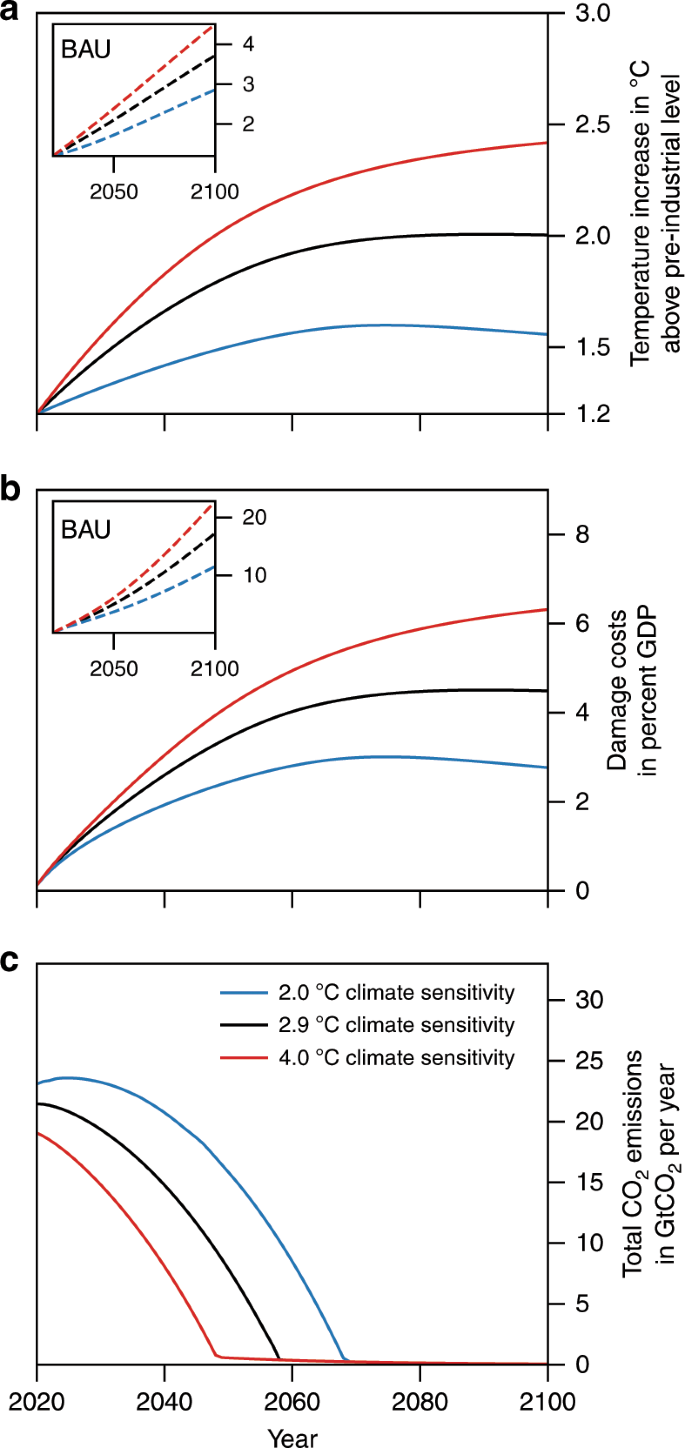
[The authors] find that the 2 °C target represents the cost-benefit optimal temperature for the base calibration (Fig. 2a). This calibration involves the best estimate8 of the temperature–economic growth relation in the past and the original ECS [equilibrium climate sensitivity] value in DICE-2013 of 2.9 °C, which is at the centre of estimates for several decades. Higher ECS values shift the level of target warming for which the mitigation-cost curve diverges to infinity to higher values (Fig. 1), i.e. they incur substantially higher mitigation costs. For ECS of 4 °C, for instance, the 2 °C target becomes too costly. Yet, with an optimal target warming of 2.4 °C the deviation from this target is not large. For smaller ECS values, e.g. of 2 °C, limiting warming further to well below 2 °C is economically optimal. Regardless of the exact ECS, the optimal mitigation efforts promise a significant damage reduction compared to the BAU [business-as-usual] scenario (~14% for ECS of 4 °C, ~10% for ECS of 2.9 °C, and ~8% for ECS of 2 °C). These efforts are, as also claimed by the Paris Agreement, ambitious (Article 3)1 and involve very stringent measures from the outset (Fig. 2c).
Fig. 1: Illustration of universality of the cost-benefit climate analysis.
Cumulative mitigation costs (green curve) and climate damages (black curve) as a function of Earthʼs warming level give the total climate costs (red curve). Mitigation costs diverge for present-day warming and converge to zero for unmitigated warming. The damages are zero for zero warming and increase with temperature. The characteristic steepness of the mitigation curve implies that beyond a certain damage level the economically optimal temperature (which minimizes the total costs) becomes insensitive to a further increase in damages. For example, increasing (black dashed) or decreasing (black dotted) the damage level by half of the initial damage level does not change the economically optimal warming level significantly (grey area).
Fig. 2: Temperature increase, damage costs, and carbon emissions under cost-benefit optimal policy for three different climate sensitivities.
The black curves are associated with the original calibration of the climate sensitivity of 2.9°C; the blue curves with a 2°C climate sensitivity and the red curve with a 4°C climate sensitivity. The inset figures allow comparing the economically optimal temperature development and damage costs with their corresponding values in the BAU scenario.