... The 2018 edition of Berkeley Lab’s Utility-Scale Solar report ... presents [an] analysis of empirical project-level data from the U.S. fleet of ground-mounted solar projects with capacities exceeding 5 MW-AC.... [The] report explores trends in deployment and project design, installed project prices, operating costs, capacity factors, power purchase agreement (PPA) prices, and the levelized cost of energy (LCOE) among both utility-scale photovoltaic (PV) and concentrating solar-thermal power (CSP) projects.
Key findings from this year’s edition of this annual report series include:
- The utility-scale PV market continues to expand geographically across the United States, with 33 states home to one or more utility-scale solar projects at the end of 2017. For the first time in the history of the U.S. market, the lion’s share (70%) of new solar capacity added in 2017 is located outside of historical strongholds California and the Southwest, with the Southeast in particular accounting for 40% of all new capacity.
- Projects that track the sun throughout the day continued to dominate fixed-tilt projects, with nearly 80% of all new utility-scale PV capacity added in 2017 employing single-axis tracking.
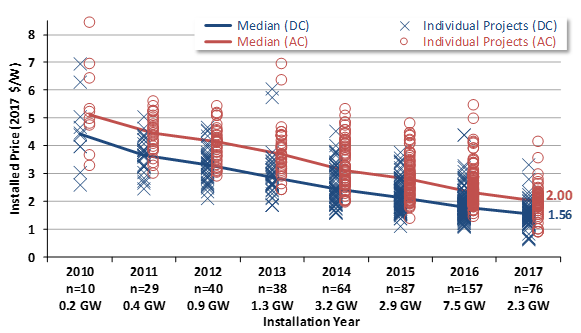
- Median installed project prices declined to $2.0/WAC (or $1.6/WDC) in 2017, with the lowest 20th percentile priced at or below $1.8/WAC (or $1.3/WDC).
- Project-level capacity factors vary widely, from 14%-35% (on an AC basis), based on a number of factors, including insolation, tracking vs. fixed-tilt, and inverter loading ratio. On an average fleetwide basis, AC capacity factors have stabilized at around 27% in recent years as the increasing use of tracking compensates for the build-out of lower-insolation sites.
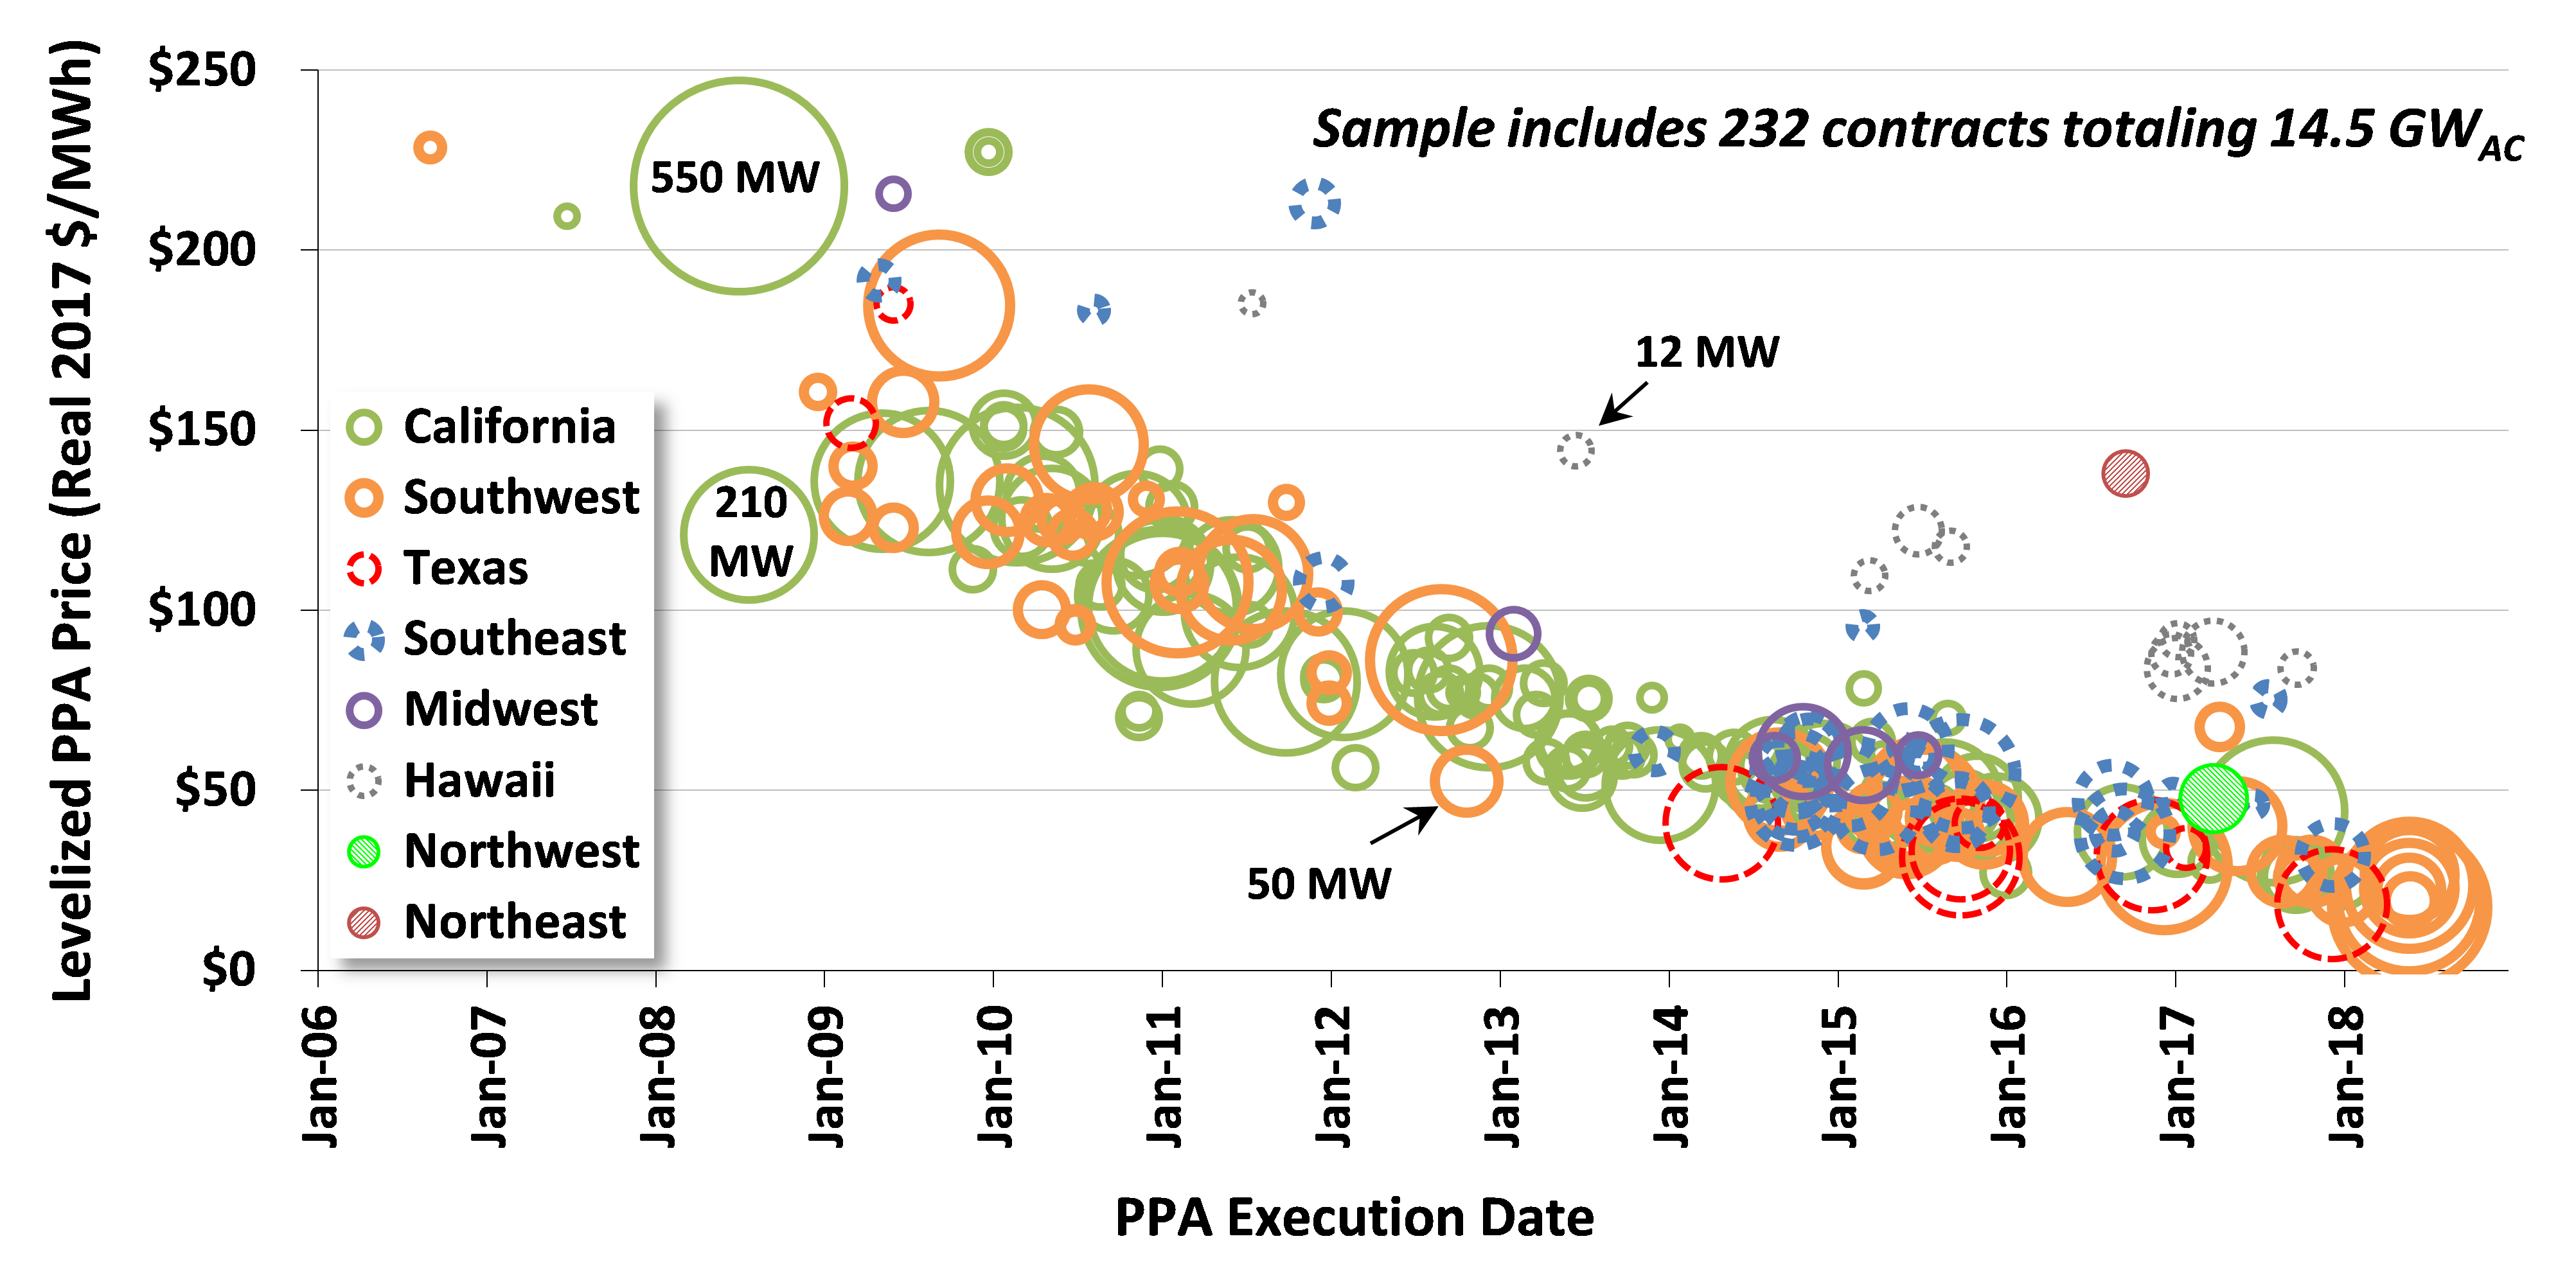
- PPA prices continued to decline, to below $40/MWh on average and with a few as low as $20/MWh (levelized, in 2017 dollars).
- These falling PPA prices have been offset to some degree by declining wholesale market value within a few high-penetration markets like California, where an abundance of mid-day solar generation has suppressed wholesale power prices (see the text box on page 37 of the full report).
- Adding battery storage to shift a portion of this excess mid-day solar generation into evening hours is one way to partially restore the wholesale market value of solar. Recent PPAs for PV plus battery storage projects suggest that this technology combination has become significantly cheaper than it was just a year ago, and is increasingly attractive in high-penetration areas (see text box on page 38 of the full report).
In addition, a free webinar summarizing key findings from the report will be held on Thursday, September 20 at 10 AM Pacific/1 PM Eastern. Register for the webinar here.
For questions on the report, feel free to contact Mark Bolinger (MABolinger@lbl.gov or Joachim Seel (JSeel@lbl.gov) at Lawrence Berkeley National Laboratory.
Lawrence Berkeley Lab Electric Policy Markets Group https://emp.lbl.gov
Also see https://emp.lbl.gov/utility-scale-solar/ which points to the following
- Installation and Technology Trends: The use of solar trackers dominated 2017 installations with nearly 80% of all new capacity. In a reflection of the ongoing geographic expansion of the market beyond California and the high-insolation Southwest, the median insolation level at newly built project sites declined again in 2017. While new fixed-tilt projects are now seen predominantly in less-sunny regions, tracking projects are increasingly pushing into these same regions. The median inverter loading ratio grew to 1.32 in 2017, allowing the inverters to operate closer to full capacity for a greater percentage of the day.
- Installed Prices: Median installed PV project prices have steadily fallen by two-thirds since the 2007-2009 period, to $2.0/WAC (or $1.6/WDC) for projects completed in 2017. The lowest 20th percentile of projects within our 2017 sample were priced at or below $1.8/WAC, with the lowest-priced projects around $0.9/WAC. Overall price dispersion across the entire sample has decreased steadily every year since 2013; similarly, price variation across regions decreased in 2017.
- Operation and Maintenance (“O&M”) Costs: PV O&M costs were in the neighborhood of $16/kWAC-year, or $8/MWh, in 2017. These numbers include only those costs incurred to directly operate and maintain the generating plant.
- Capacity Factors: The cumulative net AC capacity factors of individual projects vary widely, from 14.3% to 35.2%, with a sample median of 26.3%. This project-level variation is based on a number of factors, including the strength of the solar resource at the project site, whether the array is mounted at a fixed tilt or on a tracking mechanism, the inverter loading ratio, degradation, and curtailment. Changes in at least the first three of these factors drove mean capacity factors higher from 2010-vintage to 2013-vintage projects, where they’ve remained fairly steady among more-recent project vintages as an ongoing increase in the prevalence of tracking has been offset by a build-out of lower resource sites.
- PPA Prices and LCOE: Driven by lower installed project prices and improving capacity factors, levelized PPA prices for utility-scale PV have fallen dramatically over time, by $20-$30/MWh per year on average from 2006 through 2012, with a smaller price decline of ~$10/MWh per year evident from 2013 through 2016. Most recent PPAs in our sample—including many outside of California and the Southwest—are priced at or below $40/MWh levelized (in real 2017 dollars), with a few priced as aggressively as ~$20/MWh. The median LCOE among operational PV projects in our sample has followed PPA prices lower, suggesting a relatively competitive market for PPAs.
- Solar’s Wholesale Energy Market Value: Falling PPA prices have been offset to some degree by a decline in the wholesale energy market value of solar within higher-penetration markets like California, where solar earned just 79% of the average price across all hours within CAISO’s real-time wholesale energy market in 2017 (down from 125% back in 2012). In other markets with less solar penetration, however, solar’s hourly generation profile still earns more than the average wholesale price (e.g., 127% in ERCOT, 112% in PJM).
- Solar+Storage: Adding battery storage is one way to at least partially restore the value of solar, and three recent PV+storage PPAs in Nevada (each using 4-hour batteries sized at 25% of PV nameplate capacity) suggest that the incremental PPA price adder for storage has fallen to ~$5/MWh, down from ~$15/MWh just a year ago for a similarly configured project. As PV plus battery storage becomes more cost-effective, a number of developers are regularly offering it as a viable upgrade to standalone PV.
| 3.32 MB | |
| 3.59 MB | |
| 256.98 KB |
No comments:
Post a Comment