On March 19, 2013 The American Society of Civil Engineers (ASCE) released its 2013 Report Card for America’s Infrastructure, a comprehensive assessment of the nation’s infrastructure across 16 sectors.
Updated once every four years, this year’s Report Card found that America’s cumulative GPA for infrastructure rose slightly to a D+ from a D in 2009. The Report Card estimates total investment needs at $3.6 trillion by 2020 across all 16 sectors, leaving a funding shortfall of $1.6 trillion based on current funding levels.
The grades in 2013 range from a high of B- for solid waste infrastructure to a low of D- for inland waterways and levees. None of the categories received a lower grade than in 2009, however near-failing grades continue to be seen in numerous sectors that are crucial to the economy and Americans’ quality of life.
Encouraging trends were found in sectors where focused investments were made. Six sectors (solid waste, drinking water, wastewater, roads, bridges, and rail) each experienced incremental improvements since the last assessment. America’s rail sector saw the largest improvement, moving from a C- to a C+.
For the first time, the 2013 Report Card includes information for all 50 states and highlights initiatives and innovations that are making a difference. For example, Oklahoma created a plan to replace or rehabilitate over 950 structurally deficient bridges between 2013 and 2020. Philadelphia implemented a program to improve resiliency and address combined sewer overflows using green infrastructure, capable of capturing water from all but the most severe storms.
“We must commit today to investing in modern, efficient infrastructure systems to position the U.S. for economic prosperity,” added DiLoreto. “Infrastructure can either be the engine for long-term economic growth and employment, or, it can jeopardize our nation’s standing if poor roads, deficient bridges, and failing waterways continue to hurt our economy.”
REPORT CARD GRADES FOR SPECIFIC INFRASTRUCTURE SECTORS
Water and Environment
Dams again earned a grade of D, in part because of the increase in the nation’s aging and high-hazard dams. In fact, the average age of the country’s 84,000 dams is 52 years old.
Drinking Water systems improved slightly to a grade of D. Frequent water main breaks, pipes and mains that are frequently more than 100 years old are reaching the end of their life cycle and require significant investment, and continue to account for the low grade.
[There are an estimated 240,000 water main breaks per year in the United States. Assuming every pipe would need to be replaced, the cost over the coming decades could reach more than $1 trillion, according to the American Water Works Association (AWWA).... There are an estimated 240,000 water main breaks per year in the United States.... In 2012, the American Water Works Association (AWWA) concluded that the aggregate replacement value for more than one million miles of pipes was approximately $2.1 trillion if all pipes were to be replaced at once. Since not all pipes need to be replaced immediately, it is estimated that the most urgent investments could be spread over 25 years at a cost of approximately $1 trillion. “The need will double from roughly $13 billion a year today to almost $30 billion (in 2010 dollars) annually by the 2040s, and the cost will be met primarily through higher water bills and local fees. “Delaying the investment can result in degrading water service, increasing water service disruptions, and increasing expenditures for emergency repairs. Ultimately we will have to face the need to ‘catch up’ with past deferred investments, and the more we delay the harder the job will be when the day of reckoning comes.” By 2050, the aggregate investment needs would total more than $1.7 trillion, according to the AWWA. By contrast, the Environmental Protection Agency (EPA) needs estimates are more conservative as they do not factor in population growth. Their results in 2007 found a 20-year capital investment need of almost $334.8 billion for approximately 53,000 community water systems and 21,400 not-for-profit noncommunity water systems (including schools and churches). Among the major necessary investments, the nation required $199 billion for transmission and distribution systems, $67 billion for treatment systems, and $39 billion for water storage. The needs are greater than $1,000 per person in five regions: Far West, Great Lakes, Mid-Atlantic, Plains, and Southwest. Capital spending has not kept pace with needs for water infrastructure. The trend toward state and local governments’ assuming the bulk of the investment requirements in the coming decades will continue, with local governments’ paying an increasing share of the costs. In 2008, state and local governments estimated their total expenditures at $93 billion annually for wastewater and drinking water infrastructure. Congressional appropriations have declined over the five-year period 2008 to 2012, totaling only $6.9 billion—an average of $1.38 billion annually or $27.6 billion over 20 years, 8% of EPA’s identified needs over 20 years.]
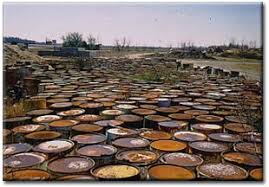
Hazardous Waste systems’ grade remained unchanged at a D. The undeniable success in the cleanup of the nation’s hazardous waste is diminished by a severe budgetary shortfall for Superfund and brownfield site cleanups. More than 400,000 brownfield sites await cleanup and redevelopment.
Wastewater systems improved slightly to a grade of D. Capital investment needs for the nation’s wastewater and stormwater systems, namely to fix and expand pipes to address sanitary sewer overflows, combined sewer overflows, and other pipe-related issues, are estimated to total $298 billion over the next 20 years.
Transportation
Aviation again earned a D grade. The number of commercial flights continues to rise, despite the effects of the recent recession, stretching the system’s ability to meet the needs of the nation’s economy. The FAA estimates that the national cost of airport congestion and delays was almost $22 billion in 2012 and will rise to $34 billion by 2020 and $63 billion by 2040.
Bridges improved to a grade of C+ given that the overall number of structurally deficient bridges continues to decrease. However, one in nine of the nation’s bridges are still rated as structurally deficient and the numbers in urban areas are rising.
Inland Waterways received a D- grade once again, as conditions remain poor and investment levels stagnant. The nation’s inland waterways and rivers carry the equivalent of about 51 million truck trips each year. Despite being essential for commerce, many portions of the inland waterways system have not been updated since the 1950s. There are an average of 52 service interruptions a day throughout the inland waterway system, and a backlog of projects with estimated completion dates stretching to the year 2090.
Ports received a C grade in its 2013 debut for assessment.More than 95 percent (by volume) of overseas trade produced or consumed by the United States moves through the nation’s ports. With the anticipated Panama Canal expansion, there has been a 9 percent increase in the size of ships calling at U.S. ports. Despite the global economy continuing to grow, federal funding has declined for navigable waterways and landside freight connections.
Rail saw the largest improvement, moving up to a C+ in 2013. America’s freight rail industry invested more than $20 billion each year from 2009 through 2012 to modernize its network. In 2012, Amtrak recorded its highest year of ridership, benefiting from federal investments in tracks, bridges, tunnels, and increased capacity from both freight and passenger operations.
Roads saw a slight improvement with a grade of D, yet America’s highways face a 42 percent congestion rate. That congestion costs the economy an estimated $101 billion annually in wasted time and fuel.
Transit’s grade remained at a D as transit agencies struggled to balance increasing ridership with declining funding, and 45 percent of American households lack any access to transit. Although access to and investment in transit has increased, deficient and deteriorating transit systems cost the U.S. economy $90 billion in 2010. Many transit agencies are struggling to maintain aging and obsolete fleets and facilities amid an economic downturn that has reduced their funding, forcing service cuts and fare increases.
Public Facilities
Public Parks and Recreation’s grade remained unchanged at a C-. The popularity of parks and outdoor recreation areas in the United States continues to grow, while localities continue to struggle with an estimated $18.5 billion in unmet budgetary needs according to 2011 numbers. The federal government is also facing a serious challenge with the National Park Service, estimating its maintenance backlog at approximately $11 billion.
Schools received a D again this year. Almost half of America’s public school buildings were built to educate the baby boomers – a generation that is now retiring from the workforce. Experts estimate the investment needed to modernize and maintain the nation’s school facilities is $270 billion or more.
Energy
Energy’s grade remained the same at a D+. The U.S. relies on an aging electrical grid and pipeline distribution system, some of which originated in the 1880s. While demand for electricity has remained level, the availability of energy will become a greater challenge after 2020 as the population increases. Although about 17,000 miles of additional high-voltage transmission lines and significant oil and gas pipelines are planned over the next five years, permitting and siting issues threaten their completion.
NEW DIGITAL APP ENHANCES REPORT CARD CONTENT
For the first time, the Report Card is available as a digital application that includes videos, state by state data, and other multimedia tools. Available for download from iTunes and Google Play, the app is supported across all major platforms and devices. It is also accessible online at www.infrastructurereportcard.org, and is supported across all major platforms and devices.
ABOUT THE ASCE REPORT CARD
Using a simple A to F school report card format, the Report Card provides a comprehensive assessment of current infrastructure conditions and needs, both assigning grades and making recommendations for how to raise them. An Advisory Council of leading civil engineers appointed by ASCE assigns the grades according to the following eight criteria: capacity, condition, funding, future need, operation and maintenance, public safety, resilience, and innovation. Since 1998, the grades have been near failing, averaging only Ds, due to delayed maintenance and underinvestment across most categories.
To view and download the 2013 Report Card for America’s Infrastructure, please visit www.infrastructurereportcard.org.
To download the 2013 Report Card for America’s Infrastructure to your phone or tablet, please visit iTunes and Google Play.
American Society of Civil Engineers www.asce.org
Press Release dated March 19, 2013
Encouraging trends were found in sectors where focused investments were made. Six sectors (solid waste, drinking water, wastewater, roads, bridges, and rail) each experienced incremental improvements since the last assessment. America’s rail sector saw the largest improvement, moving from a C- to a C+.
TRENDS CONTRIBUTING TO RISING GRADES
Key trends driving improvements included:- Renewed efforts in cities and states to address deficient roads, bridges, drinking water and wastewater systems;
- Private investment for efficiency and connectivity brought improvements in the nation’s railways, ports, and energy grid;
- Several categories benefited from short-term boosts in federal funding.
For the first time, the 2013 Report Card includes information for all 50 states and highlights initiatives and innovations that are making a difference. For example, Oklahoma created a plan to replace or rehabilitate over 950 structurally deficient bridges between 2013 and 2020. Philadelphia implemented a program to improve resiliency and address combined sewer overflows using green infrastructure, capable of capturing water from all but the most severe storms.
“We must commit today to investing in modern, efficient infrastructure systems to position the U.S. for economic prosperity,” added DiLoreto. “Infrastructure can either be the engine for long-term economic growth and employment, or, it can jeopardize our nation’s standing if poor roads, deficient bridges, and failing waterways continue to hurt our economy.”
REPORT CARD GRADES FOR SPECIFIC INFRASTRUCTURE SECTORS
Water and Environment
Dams again earned a grade of D, in part because of the increase in the nation’s aging and high-hazard dams. In fact, the average age of the country’s 84,000 dams is 52 years old.
Drinking Water systems improved slightly to a grade of D. Frequent water main breaks, pipes and mains that are frequently more than 100 years old are reaching the end of their life cycle and require significant investment, and continue to account for the low grade.
[There are an estimated 240,000 water main breaks per year in the United States. Assuming every pipe would need to be replaced, the cost over the coming decades could reach more than $1 trillion, according to the American Water Works Association (AWWA).... There are an estimated 240,000 water main breaks per year in the United States.... In 2012, the American Water Works Association (AWWA) concluded that the aggregate replacement value for more than one million miles of pipes was approximately $2.1 trillion if all pipes were to be replaced at once. Since not all pipes need to be replaced immediately, it is estimated that the most urgent investments could be spread over 25 years at a cost of approximately $1 trillion. “The need will double from roughly $13 billion a year today to almost $30 billion (in 2010 dollars) annually by the 2040s, and the cost will be met primarily through higher water bills and local fees. “Delaying the investment can result in degrading water service, increasing water service disruptions, and increasing expenditures for emergency repairs. Ultimately we will have to face the need to ‘catch up’ with past deferred investments, and the more we delay the harder the job will be when the day of reckoning comes.” By 2050, the aggregate investment needs would total more than $1.7 trillion, according to the AWWA. By contrast, the Environmental Protection Agency (EPA) needs estimates are more conservative as they do not factor in population growth. Their results in 2007 found a 20-year capital investment need of almost $334.8 billion for approximately 53,000 community water systems and 21,400 not-for-profit noncommunity water systems (including schools and churches). Among the major necessary investments, the nation required $199 billion for transmission and distribution systems, $67 billion for treatment systems, and $39 billion for water storage. The needs are greater than $1,000 per person in five regions: Far West, Great Lakes, Mid-Atlantic, Plains, and Southwest. Capital spending has not kept pace with needs for water infrastructure. The trend toward state and local governments’ assuming the bulk of the investment requirements in the coming decades will continue, with local governments’ paying an increasing share of the costs. In 2008, state and local governments estimated their total expenditures at $93 billion annually for wastewater and drinking water infrastructure. Congressional appropriations have declined over the five-year period 2008 to 2012, totaling only $6.9 billion—an average of $1.38 billion annually or $27.6 billion over 20 years, 8% of EPA’s identified needs over 20 years.]
Hazardous Waste systems’ grade remained unchanged at a D. The undeniable success in the cleanup of the nation’s hazardous waste is diminished by a severe budgetary shortfall for Superfund and brownfield site cleanups. More than 400,000 brownfield sites await cleanup and redevelopment.
[Superfund
is the common name for the Comprehensive Environmental Response,
Compensation, and Liability Act of 1980 (CERCLA), a United States
federal law designed to clean up sites contaminated with hazardous
substances. Where responsible parties cannot be found, the Agency is
authorized to clean up sites itself, using a special trust fund. There
has been undeniable success in the cleanup of the nation’s hazardous
waste and brownfields sites. However, annual funding for Superfund site
cleanup is estimated to be as much as $500 million short of what is
needed, and 1,280 sites remain on the National Priorities List with an
unknown number of potential sites yet to be identified. More than
400,000 brownfields sites await cleanup and redevelopment....Since
1980, the EPA has investigated more than 47,000 sites suspected of
releasing hazardous substances into the environment. Just over 1,600
sites have been placed on the NPL, and cleanup has been implemented at
more than two-thirds of those sites. The EPA is
also charged with identifying the parties responsible for contamination
of NPL sites and enforcing the cleanup of sites. Organizations that EPA
has deemed “potentially responsible parties” have funded cleanup of more
than 70% of the sites on the NPL, at an estimated value of nearly $30
billion. That still leaves a lot of sites that are not funded by
responsible parties. The reasons for this are many but include the
party no longer exists or has no money. Even as
needs have grown, annual congressional appropriations for Superfund have
declined by 40% since its peak of $2 billion in 1998. The Superfund
program has in the past received funding from two sources: general funds
from the U.S.Treasury and balances in the Superfund trust fund. Prior
to 1996, revenues for the trust fund came from dedicated excise taxes
and an environmental corporate income tax. Those taxes expired in
December 1995 and have not be replaced.]
Levees again earned a near failing grade of D-. The U.S. does not have a levee safety program. Public safety remains at risk as roughly $100 billion is needed to repair the nation’s estimated 100,000 miles of levees that increasingly are protecting developed communities. However, the return on investment is clear. Levees helped to prevent more than $141 billion in flood damages in 2011.Solid Waste systems earned the highest grade in 2013 of a B-. In 2010, Americans recycled 85 million tons of the 250 million tons of trash generated. This represents a 34 percent recycling rate, more than double the 14.5 percent recycled in 1980. Wastewater systems improved slightly to a grade of D. Capital investment needs for the nation’s wastewater and stormwater systems, namely to fix and expand pipes to address sanitary sewer overflows, combined sewer overflows, and other pipe-related issues, are estimated to total $298 billion over the next 20 years.
Transportation
Aviation again earned a D grade. The number of commercial flights continues to rise, despite the effects of the recent recession, stretching the system’s ability to meet the needs of the nation’s economy. The FAA estimates that the national cost of airport congestion and delays was almost $22 billion in 2012 and will rise to $34 billion by 2020 and $63 billion by 2040.
Bridges improved to a grade of C+ given that the overall number of structurally deficient bridges continues to decrease. However, one in nine of the nation’s bridges are still rated as structurally deficient and the numbers in urban areas are rising.
Inland Waterways received a D- grade once again, as conditions remain poor and investment levels stagnant. The nation’s inland waterways and rivers carry the equivalent of about 51 million truck trips each year. Despite being essential for commerce, many portions of the inland waterways system have not been updated since the 1950s. There are an average of 52 service interruptions a day throughout the inland waterway system, and a backlog of projects with estimated completion dates stretching to the year 2090.
Ports received a C grade in its 2013 debut for assessment.More than 95 percent (by volume) of overseas trade produced or consumed by the United States moves through the nation’s ports. With the anticipated Panama Canal expansion, there has been a 9 percent increase in the size of ships calling at U.S. ports. Despite the global economy continuing to grow, federal funding has declined for navigable waterways and landside freight connections.
Rail saw the largest improvement, moving up to a C+ in 2013. America’s freight rail industry invested more than $20 billion each year from 2009 through 2012 to modernize its network. In 2012, Amtrak recorded its highest year of ridership, benefiting from federal investments in tracks, bridges, tunnels, and increased capacity from both freight and passenger operations.
Roads saw a slight improvement with a grade of D, yet America’s highways face a 42 percent congestion rate. That congestion costs the economy an estimated $101 billion annually in wasted time and fuel.
Transit’s grade remained at a D as transit agencies struggled to balance increasing ridership with declining funding, and 45 percent of American households lack any access to transit. Although access to and investment in transit has increased, deficient and deteriorating transit systems cost the U.S. economy $90 billion in 2010. Many transit agencies are struggling to maintain aging and obsolete fleets and facilities amid an economic downturn that has reduced their funding, forcing service cuts and fare increases.
Public Facilities
Public Parks and Recreation’s grade remained unchanged at a C-. The popularity of parks and outdoor recreation areas in the United States continues to grow, while localities continue to struggle with an estimated $18.5 billion in unmet budgetary needs according to 2011 numbers. The federal government is also facing a serious challenge with the National Park Service, estimating its maintenance backlog at approximately $11 billion.
Schools received a D again this year. Almost half of America’s public school buildings were built to educate the baby boomers – a generation that is now retiring from the workforce. Experts estimate the investment needed to modernize and maintain the nation’s school facilities is $270 billion or more.
Energy
Energy’s grade remained the same at a D+. The U.S. relies on an aging electrical grid and pipeline distribution system, some of which originated in the 1880s. While demand for electricity has remained level, the availability of energy will become a greater challenge after 2020 as the population increases. Although about 17,000 miles of additional high-voltage transmission lines and significant oil and gas pipelines are planned over the next five years, permitting and siting issues threaten their completion.
NEW DIGITAL APP ENHANCES REPORT CARD CONTENT
For the first time, the Report Card is available as a digital application that includes videos, state by state data, and other multimedia tools. Available for download from iTunes and Google Play, the app is supported across all major platforms and devices. It is also accessible online at www.infrastructurereportcard.org, and is supported across all major platforms and devices.
ABOUT THE ASCE REPORT CARD
Using a simple A to F school report card format, the Report Card provides a comprehensive assessment of current infrastructure conditions and needs, both assigning grades and making recommendations for how to raise them. An Advisory Council of leading civil engineers appointed by ASCE assigns the grades according to the following eight criteria: capacity, condition, funding, future need, operation and maintenance, public safety, resilience, and innovation. Since 1998, the grades have been near failing, averaging only Ds, due to delayed maintenance and underinvestment across most categories.
To view and download the 2013 Report Card for America’s Infrastructure, please visit www.infrastructurereportcard.org.
To download the 2013 Report Card for America’s Infrastructure to your phone or tablet, please visit iTunes and Google Play.
American Society of Civil Engineers www.asce.org
Press Release dated March 19, 2013
No comments:
Post a Comment